Hi,
I would like to specify some arguments (colour, linetype) of plot in autopilot on a forecast object, but it doesn't work.
Code enclosed
library(forecast)
#> Warning: package 'forecast' was built under R version 3.6.3
#> Registered S3 method overwritten by 'quantmod':
#> method from
#> as.zoo.data.frame zoo
library(tidyverse)
#> Warning: package 'tidyverse' was built under R version 3.6.3
#> Warning: package 'ggplot2' was built under R version 3.6.3
#> Warning: package 'tibble' was built under R version 3.6.3
#> Warning: package 'tidyr' was built under R version 3.6.3
#> Warning: package 'dplyr' was built under R version 3.6.3
#> Warning: package 'forcats' was built under R version 3.6.3
ld_y <- c(0, -0.247049511424917, -0.209066160929232, 0.0232083547024029, -0.0573451829158251, 0.0464897709019544, 0.285377182432085, 0.0506005987899635, 0.403417474837009, -0.159173983892748, -0.00178502492425098)
ld_y <- ts(ld_y)
arima <-
ld_y %>% auto.arima(trace = T,
approximation = F,
seasonal = F)
#>
#> ARIMA(2,0,2) with non-zero mean : Inf
#> ARIMA(0,0,0) with non-zero mean : -0.2698814
#> ARIMA(1,0,0) with non-zero mean : 3.614577
#> ARIMA(0,0,1) with non-zero mean : 3.628257
#> ARIMA(0,0,0) with zero mean : -3.277957
#> ARIMA(1,0,1) with non-zero mean : 8.758265
#>
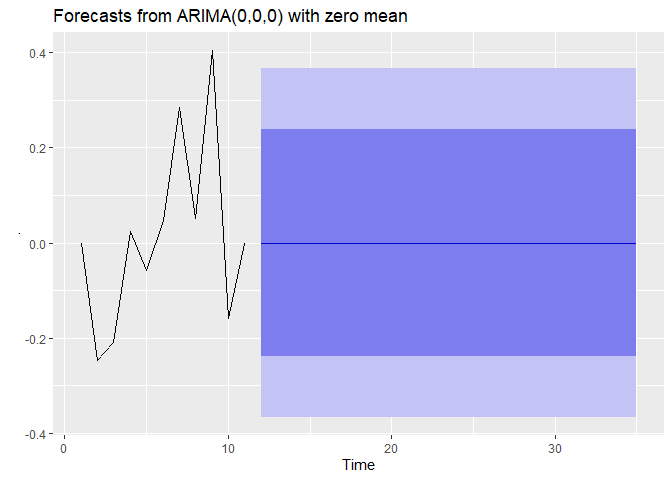
#> Best model: ARIMA(0,0,0) with zero mean
forecast(arima, h = 24) %>% autoplot(
predict.colour = 'red',
predict.linetype = 'dashed',
conf.int = FALSE
)
Created on 2020-08-18 by the reprex package (v0.3.0)
Thank for the help in advance
Marcell
