My question is related to this topic:
https://forum.posit.co/t/how-to-create-a-for-loop-to-perform-correlation-analysis-in-r/185289
In spite of following the solution, it throws an error after the for loop has been finished:
Error in `[<-`(`*tmp*`, , i, value = CorVals[1:3, 4]) :
  subscript out of bounds
That was no proper data format for reprex, so I had to copy/paste to excel from screen and back import to R.
Here is my data and the rest there is FJCC's code from link above:
M8.3.sample.anno <- structure(list(Samples = c("lib224", "lib225", "lib259", "lib265",
"lib272", "lib308", "lib322", "lib328", "lib335", "lib355", "lib242",
"lib248", "lib253", "lib260", "lib266", "lib302", "lib316", "lib323",
"lib329", "lib349", "lib246", "lib252", "lib257", "lib264", "lib270",
"lib306", "lib320", "lib327", "lib333", "lib353"), Cell.type = c("Whole Blood Type 1",
"Whole Blood Type 1", "Whole Blood", "Whole Blood", "Whole Blood",
"Whole Blood", "Whole Blood", "Whole Blood Type 1", "Whole Blood Type 1",
"Whole Blood", "Neutrophils Type 1", "Neutrophils Type 1", "Neutrophils",
"Neutrophils", "Neutrophils", "Neutrophils", "Neutrophils", "Neutrophils Type 1",
"Neutrophils Type 1", "Neutrophils", "CD8 Type 1", "CD8 Type 1",
"CD8", "CD8", "CD8", "CD8", "CD8", "CD8 Type 1", "CD8 Type 1",
"CD8"), Subjects = c("Diabetes", "Diabetes", "Sepsis", "Sepsis",
"Sepsis", "ALS", "ALS", "Diabetes", "Diabetes", "ALS", "Diabetes",
"Diabetes", "Sepsis", "Sepsis", "Sepsis", "ALS", "ALS", "Diabetes",
"Diabetes", "ALS", "Diabetes", "Diabetes", "Sepsis", "Sepsis",
"Sepsis", "ALS", "ALS", "Diabetes", "Diabetes", "ALS"), M8.3_EPSTI1 = c(5.058453,
4.450353, 5.135682, 1.880949, 3.169424, 5.247415, 5.263406, 5.274372,
4.778972, 4.768332, 5.253648, 3.877802, 4.645075, 2.322131, 1.183076,
4.421727, 5.257992, 6.11618, 4.955377, 5.27552, 3.889786, 3.534158,
4.198376, 3.187057, 3.849569, 3.854546, 4.451968, 4.306357, 3.527393,
3.995013), M8.3_HERC5 = c(4.88702, 4.718768, 3.956515, 2.522847,
1.957587, 4.754137, 4.661308, 5.289623, 4.913245, 4.582032, 7.039871,
6.501353, 4.384019, 2.971893, 2.26658, 5.900319, 6.495806, 7.677564,
6.370284, 5.591712, 3.608076, 3.501803, 3.794708, 3.552989, 3.864689,
3.361594, 3.259045, 3.709678, 2.824222, 3.441016), M8.3_HES4 = c(1.7671376,
1.2454535, 1.3199113, 0.141693, 1.5035259, 2.2679888, 2.4815427,
2.1011256, 2.5630369, 1.5406692, 1.3155759, 2.2587263, 0.2715198,
0, 0, 2.3356959, 3.4147835, 2.6296078, 2.0181739, 0.9455944,
0.9921601, 0.9057364, 1.0898153, 0.2858425, 0.2660382, 1.7794049,
1.1280926, 0.8845468, 0.7876389, 0.9899005), M8.3_Avg = c(3.90420353333333,
3.47152483333333, 3.47070276666667, 1.515163, 2.21017896666667,
4.08984693333333, 4.1354189, 4.22170686666667, 4.08508463333333,
3.6303444, 4.53636496666667, 4.2126271, 3.1002046, 1.76467466666667,
1.14988533333333, 4.2192473, 5.05619383333333, 5.4744506, 4.44794496666667,
3.9376088, 2.83000736666667, 2.64723246666667, 3.0276331, 2.34196283333333,
2.66009873333333, 2.99851496666667, 2.94636853333333, 2.9668606,
2.3797513, 2.80864316666667)), row.names = c(NA, -30L), class = c("tbl_df",
"tbl", "data.frame"))
library(readr)
M8.3.sample.anno <- read_delim("M8_3_sample_anno.csv",
delim = ";", escape_double = FALSE, trim_ws = TRUE)
geneNames <- gene_columns.M8.3 <- colnames(M8.3.sample.anno)[grepl("^M8.3_", colnames(M8.3.sample.anno))]
# Calculate row means for selected columns, specific to cell type and add as a new column named 'M8.3_Avg'
M8.3.sample.anno <- M8.3.sample.anno %>%
mutate(M8.3_Avg = rowMeans(select(., starts_with("M8.3_")), na.rm = TRUE))
TYPES <- unique(M8.3.sample.anno$Cell.type)
# Initialize a matrix to store correlation coefficients
correlations <- matrix(NA, nrow = 3,ncol = 3)
for(i in seq_along(TYPES)) {
tmp <- M8.3.sample.anno |> filter(Cell.type == TYPES[i]) |>
select(starts_with("M8.3"))
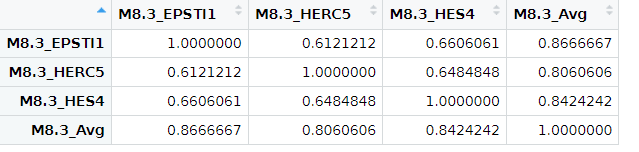
CorVals <- tmp |> cor(method = "spearman")
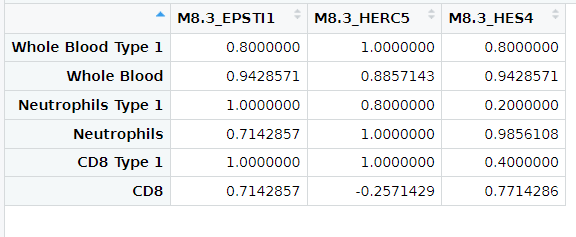
correlations[, i] <- CorVals[1:3, 4]
}
dimnames(correlations) = list(geneNames, TYPES)
correlations
What do I do wrong ? Thank you for your help.