For loop or other way to resolve this

Hi ALL, I need please help with this:
I have this data and code:

data_data_long <-  structure(list(occurrence = c("yes", "yes", "yes", "no", "no", 
"no", "yes", "yes", "yes", "no", "no", "no", "yes", "yes", "yes", 
"no", "no", "no", "yes", "yes", "yes", "no", "no", "no", "yes", 
"yes", "yes", "no", "no", "no", "yes", "yes", "yes", "no", "no", 
"no", "yes", "yes", "yes", "no", "no", "no", "yes", "yes", "yes", 
"no", "no", "no"), group = structure(c(1L, 1L, 1L, 1L, 1L, 1L, 
1L, 1L, 1L, 1L, 1L, 1L, 1L, 1L, 1L, 1L, 1L, 1L, 1L, 1L, 1L, 1L, 
1L, 1L, 2L, 2L, 2L, 2L, 2L, 2L, 2L, 2L, 2L, 2L, 2L, 2L, 2L, 2L, 
2L, 2L, 2L, 2L, 2L, 2L, 2L, 2L, 2L, 2L), levels = c("Ia", "IIa"
), class = "factor"), sex = structure(c(1L, 1L, 1L, 1L, 1L, 1L, 
1L, 1L, 1L, 1L, 1L, 1L, 2L, 2L, 2L, 2L, 2L, 2L, 2L, 2L, 2L, 2L, 
2L, 2L, 1L, 1L, 1L, 1L, 1L, 1L, 1L, 1L, 1L, 1L, 1L, 1L, 2L, 2L, 
2L, 2L, 2L, 2L, 2L, 2L, 2L, 2L, 2L, 2L), levels = c("Female", 
"Male"), class = "factor"), side = structure(c(1L, 1L, 1L, 1L, 
1L, 1L, 2L, 2L, 2L, 2L, 2L, 2L, 1L, 1L, 1L, 1L, 1L, 1L, 2L, 2L, 
2L, 2L, 2L, 2L, 1L, 1L, 1L, 1L, 1L, 1L, 2L, 2L, 2L, 2L, 2L, 2L, 
1L, 1L, 1L, 1L, 1L, 1L, 2L, 2L, 2L, 2L, 2L, 2L), levels = c("left", 
"right"), class = "factor"), n = c(128, 128, 128, 128, 128, 128, 
128, 128, 128, 128, 128, 128, 84, 84, 84, 84, 84, 84, 84, 84, 
84, 84, 84, 84, 131, 131, 131, 131, 131, 131, 131, 131, 131, 
131, 131, 131, 71, 71, 71, 71, 71, 71, 71, 71, 71, 71, 71, 71
), symptom = structure(c(1L, 2L, 3L, 1L, 2L, 3L, 1L, 2L, 3L, 
1L, 2L, 3L, 1L, 2L, 3L, 1L, 2L, 3L, 1L, 2L, 3L, 1L, 2L, 3L, 1L, 
2L, 3L, 1L, 2L, 3L, 1L, 2L, 3L, 1L, 2L, 3L, 1L, 2L, 3L, 1L, 2L, 
3L, 1L, 2L, 3L, 1L, 2L, 3L), levels = c("r1", "r2", "r3"), class = "factor"), 
    frequency = c(47, 32, 57, 81, 96, 71, 49, 27, 68, 79, 101, 
    60, 44, 35, 56, 40, 49, 28, 45, 35, 55, 39, 49, 29, 44, 30, 
    58, 87, 101, 73, 47, 34, 72, 84, 97, 59, 30, 29, 41, 41, 
    42, 30, 36, 30, 40, 35, 41, 31)), row.names = c(NA, -48L), class = c("tbl_df", 
"tbl", "data.frame"))

symptoms <- data_data_long %>% select(symptom) %>% distinct() %>% unlist()

sex <- data_data_long %>% select(sex) %>% distinct() %>% unlist()
  
side <- data_data_long %>% select(side) %>% distinct() %>% unlist()

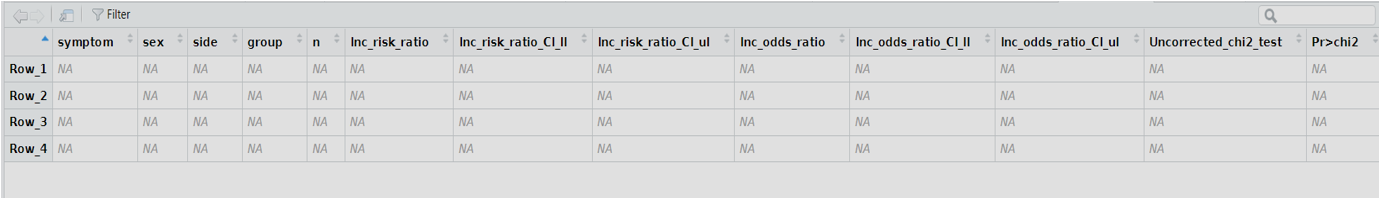
names_of_columns <- c("Symptoms","Sex","Side","Group","Incidence","n","Incidence_risk", "Incidence_risk_CIll",  "Incidence_risk_CIul", "Incidence_OR",  
"Incidence_OR_CIll", "Incidence_OR_CIul",
 "x2", "pvalue")

my_matrix <-  matrix(NA, nrow = length( symptoms) * length(sex) * length(side) , 
ncol = length(names_of_columns), dimnames= list(c(), names_of_columns ))

rownames(my_matrix) <- paste0("Row_", seq_len(nrow(my_matrix)))

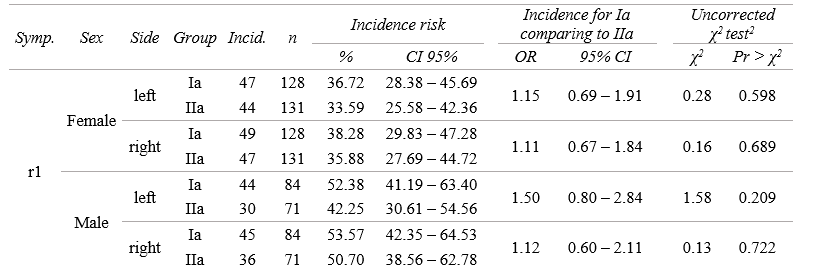
I want to fill in this earlier prepared empty matrix using for loop in R so I want to get results in my_matrix with Symptoms from r1 to r3, Sex: Female and Male, Side: Left and Right, Group: Ia or IIa, Incidence that is incidence risk, n – that is the number of participants in group, Incidence_risk that is incidence risk, Incidence_risk_CIll – that is confidence intervals for Incidence risk lower limit, Incidence_risk_CIul - that is confidence intervals for Incidence risk upper limit, Incidence_OR- that is inc odds ratio, and subsequently confidence intervals for Incidence odds ratio lower and upper limit, x2 which is value of chi square statistics and pvalue of chi square test.
All these results must be extracted from output of this function:

library(epiR)
data_data_long %>%  dplyr::filter( sex == "Female", side =="left", symptom =="r1") %>% 
  dplyr::select(frequency) %>% unlist() %>% 
  matrix(., ncol =2, dimnames = list(c("Occurrence", "Not occurrence"), c("Ia", "IIa"))) %>% t() %>%  
  epi.2by2(dat = ., method = "cohort.count", conf.level = 0.95, units = 100, 
interpret = FALSE, outcome = "as.columns")

and so on for r2 and r3, for female and male, group Ia and IIa, side: left and right, etc. Please help. Or maybe you know a way without using for loop ? Thank you.

I dont think the dimensions of your my_matrix would accomodate the info you propose to get from the eip.2by2 output

ok, the first 3 columns of the matrix are trivial as per your example , Female, left , r1
what should be the Group ? doesnt your output concern multiple groups ?

             Outcome +    Outcome -      Total                 Inc risk *
Exposed +           47           81        128     36.72 (28.38 to 45.69)
Exposed -           44           87        131     33.59 (25.58 to 42.36)
Total               91          168        259     35.14 (29.33 to 41.29)

Point estimates and 95% CIs:
-------------------------------------------------------------------
Inc risk ratio                                 1.09 (0.78, 1.52)
Inc odds ratio                                 1.15 (0.69, 1.91)
Attrib risk in the exposed *                   3.13 (-8.49, 14.76)
Attrib fraction in the exposed (%)            8.53 (-27.39, 34.32)
Attrib risk in the population *                1.55 (-8.41, 11.51)
Attrib fraction in the population (%)         4.40 (-13.44, 19.44)
-------------------------------------------------------------------
Uncorrected chi2 test that OR = 1: chi2(1) = 0.278 Pr>chi2 = 0.598
Fisher exact test that OR = 1: Pr>chi2 = 0.605
 Wald confidence limits
 CI: confidence interval
 * Outcomes per 100 population units 

which value shown here should go into that Group ? or what should decide what goes into the group column ?

I see that on your way to epi.2by2 you specificy the group names ...

    Occurrence Not occurrence
Ia          47             81
IIa         44             87

but this is a matrix, containing two group names, and there are 4 numeric values relating to those two names.
And its not clear to me what would fit appropriately into 1 cell called Group in your final table ....

Thank you, my desired outcome would be like this table below, for example for r1 symptom:

and I have been trying to do it in R using initialized matrix like this:

Obviously I could manually calculate separate steps like this:

library(tidyverse)
library(epiR)

data_data_long %>%  dplyr::filter( sex == "Female", side =="left", symptom =="r1") %>% 
  dplyr::select(frequency) %>% unlist() %>% 
  matrix(., ncol =2, dimnames = list(c("Occurrence", "Not occurrence"), c("Ia", "IIa"))) %>% t() %>%  
  epi.2by2(dat = ., method = "cohort.count", conf.level = 0.95, units = 100, 
interpret = FALSE, outcome = "as.columns")

data_data_long %>%  dplyr::filter( sex == "Female", side =="right", symptom =="r1") %>% 
  dplyr::select(frequency) %>% unlist() %>% 
  matrix(., ncol =2, dimnames = list(c("Occurrence", "Not occurrence"), c("Ia", "IIa"))) %>% t() %>%  
  epi.2by2(dat = ., method = "cohort.count", conf.level = 0.95, units = 100, 
interpret = FALSE, outcome = "as.columns")

data_data_long %>%  dplyr::filter( sex == "Male", side =="left", symptom =="r1") %>% 
  dplyr::select(frequency) %>% unlist() %>% 
  matrix(., ncol =2, dimnames = list(c("Occurrence", "Not occurrence"), c("Ia", "IIa"))) %>% t() %>%  
  epi.2by2(dat = ., method = "cohort.count", conf.level = 0.95, units = 100, 
interpret = FALSE, outcome = "as.columns")

data_data_long %>%  dplyr::filter( sex == "Male", side =="right", symptom =="r1") %>% 
  dplyr::select(frequency) %>% unlist() %>% 
  matrix(., ncol =2, dimnames = list(c("Occurrence", "Not occurrence"), c("Ia", "IIa"))) %>% t() %>%  
  epi.2by2(dat = ., method = "cohort.count", conf.level = 0.95, units = 100, 
interpret = FALSE, outcome = "as.columns")

and then copy/paste results of above steps into MS Word but I was wondering because in total I have got 27 symptoms if it would be more automated way using for loop or any other way, if possible, please.
If I had known how to do it for r1, r2, and r3 as a start, then I would have been able to adapt the solution for all 27 symptoms (r1 - r27). Incidence risk was calculated as outcomes per 100 patients with H0: OR = 1.

Thank you in advance.