To modify this kind of UI styling, you need to work with CSS.
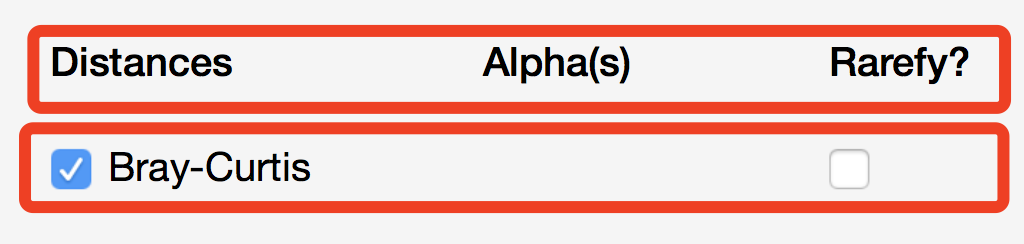
fluidRow is just creating a div HTML tag with class .row. So you can use a css file, modifying style for all row using .row selector and add border css property to them. (https://www.w3schools.com/css/css_border.asp)
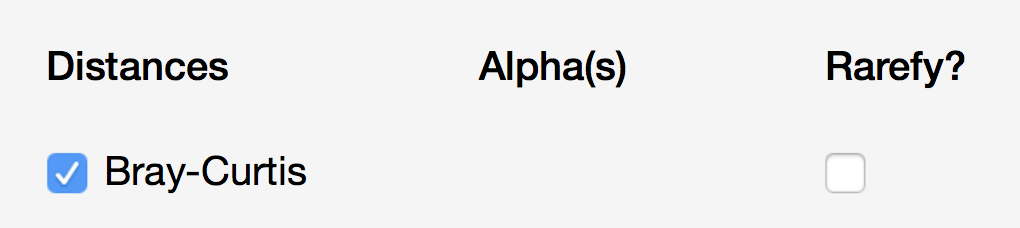
Putting ids on your rows or element, you'll be able to customize your ui more precisely.
shinyApp(
  ui = fluidPage(
    titlePanel("Some rows with border"),
    tags$style(HTML("
      #first {
          border: 4px double red;
      }
      #second {
          border: 2px dashed blue;
      }
    ")),
    fluidRow(id = "first",
      numericInput("n", "n", 1)
    ),
    fluidRow(
      tags$br()
    ),
    fluidRow(id = "second",
      plotOutput("plot")
    )
  ),
  server = function(input, output, session) {
    output$plot <- renderPlot( plot(head(cars, input$n)) )
  }
)
You can also to that with inline css tag by tag. Sometimes it is useful when it needs small modification, but a custom css is better
library(shiny)
shinyApp(
  ui = fluidPage(
    titlePanel("Some rows with border"),
    fluidRow(style = "border: 4px double red;",
      numericInput("n", "n", 1)
    ),
    fluidRow(
      tags$br()
    ),
    fluidRow(style = "border: 2px dashed blue;",
      plotOutput("plot")
    )
  ),
  server = function(input, output, session) {
    output$plot <- renderPlot( plot(head(cars, input$n)) )
  }
)
See shiny documentation on how to modify css
https://shiny.rstudio.com/articles/css.html