Hi all,
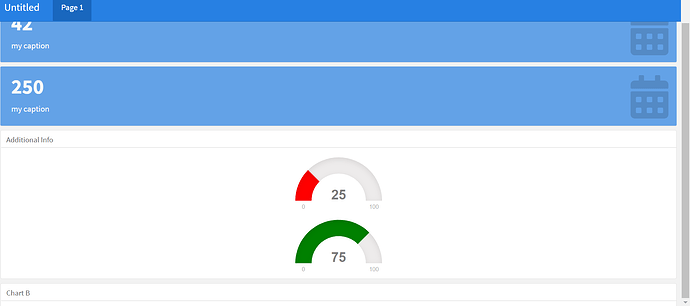
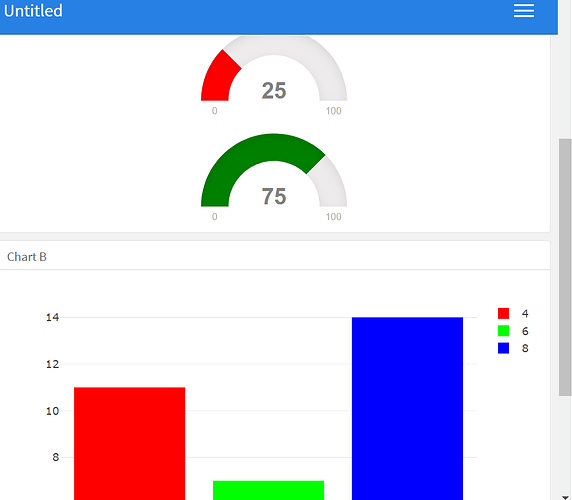
I'm playing around with Flexdashboards, trying to see what they're capable of and what their limits are. I've come across some odd scrolling behaviour and was hoping for advice on a fix, as I haven't been able to find one online. As shown in the attached images, the vertical scrolling behaviour isn't currently correct, as it won't scroll fully to show the contents of Chart B when viewed on a small screen.
Code is attached. Apologies for not making it smaller, but I needed to replicate the issue and that involves stacking a few vertical charts. I was expecting the vertical scroll option to allow for effectively unlimited stacking of charts, so any advice would be great.
---
title: "Untitled"
output: flexdashboard::flex_dashboard
orientation: row
vertical_layout: scroll

---

```{r setup, include=FALSE}
library(flexdashboard)
library(plotly)

dataset <- mtcars
Page 1
================================

Row
-----------------------------------------------------------------------


### ValueBox 1

```{r}
valueBox(42, caption = "my caption", icon = "fa-calendar")
### ValueBox 2

```{r}
valueBox(250, caption = "my caption", icon = "fa-calendar")
### Additional Info


```{r}

sector_levels <- gaugeSectors(success = c(0, 40),
                              warning = c(40, 60),
                              danger = c(60, 100),
                              colors= c("red", "yellow", "green"))


g1 <- gauge(25, min = 0, max = 100, sectors = sector_levels)
g2 <- gauge(75, min = 0, max = 100, sectors = sector_levels)

g1
g2
###  Chart B
```{r}
color_map <- c("4" = "red", "6" = "green", "8"  ="blue")


plot1 <- plot_ly(data = dataset, x = ~dataset$cyl, color = ~as.factor(cyl), colors = color_map,
  type = "histogram")

plot1 <- plot1 %>% layout(legend = c, xaxis = list(title = "Also a Test"))

plot1

