Sheni
May 13, 2020, 3:09pm
1
Hello,
I have wrote the following code to plot my graph, but there is an error of "Error: Cannot add ggproto objects together. Did you forget to add this object to a ggplot object?"
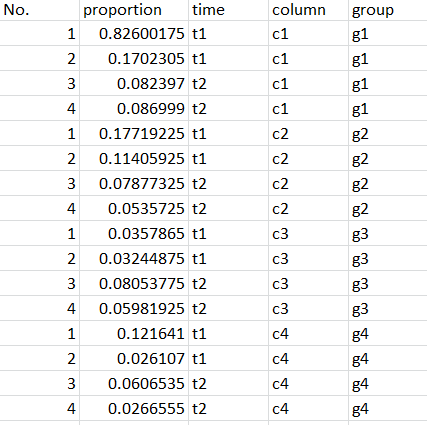
here is part of my data:
No.	proportion		time	column	group
1	0.82600175	    t1	c1	g1
2	0.1702305	    t1	c1	g1
3	0.082397		t2	c1	g1
4	0.086999		t2	c1	g1
1	0.17719225	    t1	c2	g2
2	0.11405925	    t1	c2	g2
3	0.07877325   	t2	c2	g2
4	0.0535725		t2	c2	g2
1	0.0357865		t1	c3	g3
2	0.03244875	    t1	c3	g3
3	0.08053775	    t2	c3	g3
4	0.05981925  	t2	c3	g3
1	0.121641		t1	c4	g4
2	0.026107		t1	c4	g4
3	0.0606535		t2	c4	g4
4	0.0266555		t2	c4	g4
code:
library(ggplot2)
library(dplyr)
library(tidyr)
library(tidyverse)
require(gridExtra)
file1<-read.csv("H:/prop.csv")
colm=c("t1"="red","t2"="blue","t3"="coral4","t4"="orange")
labels1 <- c("column 1","column 2","column 3","column 4")
title<-"Column"
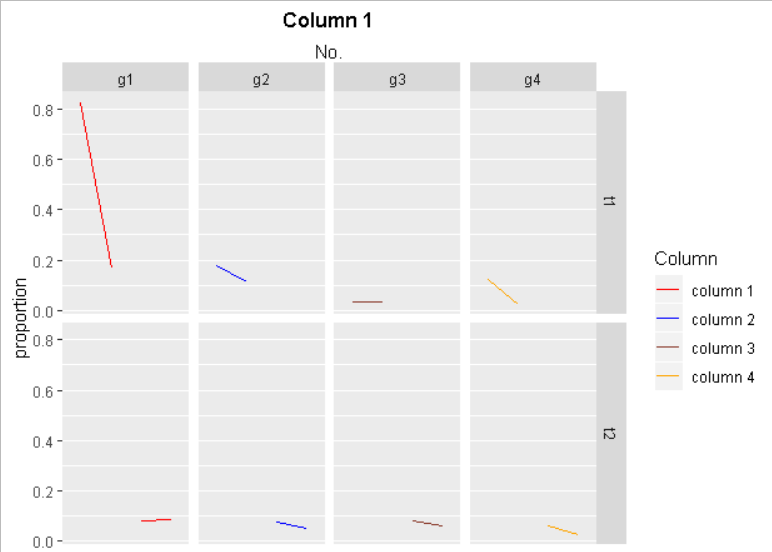
b1<-ggplot(file1, aes(x=No.,colour=column))+
geom_line(aes(y = proportion))+
xlab("Number")+ylab("proportion")+
scale_color_manual(values =c("t1"="red","t2"="blue","t3"="coral4","t4"="orange"), labels=labels1 ,name="Time")+
guides(colour = guide_legend(title=title))+
labs(title="Column 1")+ theme(plot.title=element_text(size=12,hjust=0.5,face="bold"))+
scale_x_discrete(position = "top")+ facet_grid(vars(time), vars(group))
b1
Would you help me fix this problem please?
Thanks
you must have made a mistake reproducing your issue for us to analyse as your code doesnt show the particular error you quoted when I run it. ?
colm=c("c1"="red","c2"="blue","c3"="coral4","c4"="orange")
scale_color_manual(values =colm, labels=labels1 ,name="Time")+
Sheni
May 13, 2020, 4:20pm
3
Thanks a lot. However, when I change colm
there is an error of
Error: Insufficient values in manual scale. 5 needed but only 4 provided.
you have more data than the example you shared with us perhaps.
Sheni
May 13, 2020, 4:27pm
5
I am using the same data.
ok, please copy and paste your whole code again, perhaps I can spot another typo or something....
Sheni
May 13, 2020, 4:50pm
7
That would be so kind of you.
here is the data (larger part of whole data):
No.	proportion	time	column	group
1	0.82600175	t1	c1	g1
2	0.1702305	t1	c1	g2
3	0.082397	t2	c1	g3
4	0.086999	t2	c1	g4
1	0.17719225	t1	c2	g1
2	0.11405925	t1	c2	g2
3	0.07877325	t2	c2	g3
4	0.0535725	t2	c2	g4
1	0.0357865	t1	c3	g1
2	0.03244875	t1	c3	g2
3	0.08053775	t2	c3	g3
4	0.05981925	t2	c3	g4
1	0.121641	t1	c4	g1
2	0.026107	t1	c4	g2
3	0.0606535	t2	c4	g3
4	0.0266555	t2	c4	g4
1	0.07953675	t1	c1	g1
2	0.02143375	t1	c1	g2
3	0.025964	t2	c1	g3
4	0.01788125	t2	c1	g4
1	0.05903225	t1	c2	g1
2	0.0279665	t1	c2	g2
3	0.02522475	t2	c2	g3
4	0.01013275	t2	c2	g4
1	0.03747925	t1	c3	g1
2	0.00936975	t1	c3	g2
3	0.0266075	t2	c3	g3
4	0.02682225	t2	c3	g4
1	0.0439645	t1	c4	g1
2	0.12304775	t1	c4	g2
3	0.0819445	t2	c4	g3
4	0.56352575	t2	c4	g4
and this is the code:
library(ggplot2)
library(dplyr)
library(tidyr)
library(tidyverse)
require(gridExtra)

file1<-read.csv("H:/prop.csv")
colm=c("c1"="red","c2"="blue","c3"="coral4","c4"="orange")

labels1 <- c("column 1","column 2","column 3","column 4")

title<-"Column"

b1<-ggplot(file1, aes(x=No.,colour=column))+
  geom_line(aes(y = proportion))+
  xlab("Number")+ylab("proportion")+
  scale_color_manual(values values =colm, labels=labels1 ,name="Time")+
  guides(colour = guide_legend(title=title))+
  labs(title="Column 1")+ theme(plot.title=element_text(size=12,hjust=0.5,face="bold"))+
  scale_x_discrete(position = "top")+  facet_grid(vars(time), vars(group))

b1
it runs fine for me without errors...
library(ggplot2)
library(dplyr)
library(tidyr)
library(tidyverse)
require(gridExtra)
the first 3 can be replaced by the
library(tidyverse)
on its own, and you dont use gridExtra in the code you shared.
packageVersion("tidyverse")
you can also try to update the tidyverse
tidyverse::tidyverse_update(recursive = TRUE)
running this will write out an install.packages command that you can copy and paste, to run after restarting R (ctrl+shift+f10)
1 Like
system
June 3, 2020, 5:53pm
9
This topic was automatically closed 21 days after the last reply. New replies are no longer allowed.