Mawuli
March 21, 2020, 6:08pm
1
I have 4 time series plots on the same graph and I want to fit a trendline on all. I used ggplot and added the remaining two plots with the geom_line sub-function. When I used the geom_smooth function to fit the equation line, it only does it for the first graph leaving the other 2. Please, this is the link to the file I used for the code (https://drive.google.com/open?id=16k1cMMr1dthJOsppazVZ3cUCa1rRGF9m ) and below is the code.
nf <- read.csv("F:/Project work/Publication/Under writing/Heat stress/nf_tas.csv", sep = ",", header = TRUE)
nf$date_mpi <- as.Date(as.character(nf$date_mpi))

nfu <- ggplot(data = nf, aes(x=nf$date_mpi, y=nf$mpi_nf))+
  labs(title = "Annual temperature trends", x="Near-future projection", y="Temperature [°C]")+
  scale_y_continuous(limits = c(24,31)) +
  geom_line(aes(y=nf$mpi_nf, color='WRF-MPI-ESM MR'))+
  geom_line(aes(y=nf$hadgem_nf, color='WRF-HadGEM2-ES'))+
  geom_line(aes(y=nf$gfdl_nf, color='WRF-GFDL-ESM2M'))+ theme(legend.position = c(.1,.85))


nfu + theme(text = element_text(size = 12))
#> Error in eval(expr, envir, enclos): object 'nfu' not found
Created on 2020-03-22 by the reprex package (v0.2.1)
I'd appreciate if I could be assisted in this regard.
Hi @Mawuli , could you repost your code? I doesn't look like it came through.
1 Like
Mawuli
March 22, 2020, 4:11pm
3
Hello Dromano
Thanks for flagging this across. The reprex has now be added.
Based on your introductory text, I was looking for a geom_smooth and I didnt see it in the code provided. Is there a second code showing your attempted use of it ? thanks
Mawuli
March 22, 2020, 8:41pm
5
That's true. I have updated this now.
Mawuli
March 22, 2020, 8:45pm
6
I am somehow unable to edit my earlier post so I've posted the code here please
nf <- read.csv("F:/Project work/Publication/Under writing/Heat stress/nf_tas.csv", sep = ",", header = TRUE)
nf$date_mpi <- as.Date(as.character(nf$date_mpi))

nfu <- ggplot(data = nf, aes(x=nf$date_mpi, y=nf$mpi_nf))+
  labs(title = "Annual temperature trends", x="Near-future projection", y="Temperature [°C]")+
  scale_y_continuous(limits = c(24,31)) +
  geom_line(aes(y=nf$mpi_nf, color='WRF-MPI-ESM MR'))+ geom_smooth(method = "lm", se=FALSE, formula = my.formula)+
  geom_line(aes(y=nf$hadgem_nf, color='WRF-HadGEM2-ES'))+ geom_smooth(method = "lm", se=FALSE, formula = my.formula)+
  geom_line(aes(y=nf$gfdl_nf, color='WRF-GFDL-ESM2M'))+ theme(legend.position = c(.1,.85))
#> Error in ggplot(data = nf, aes(x = nf$date_mpi, y = nf$mpi_nf)): could not find function "ggplot"
Created on 2020-03-22 by the reprex package (v0.2.1)
Mawuli
April 9, 2020, 3:23pm
7
Hello guys, I posted a problem here 18 days ago which I've still not been able to resolve. Any help from you guys would be greatly appreciated as I am in a fix at the moment. Many thanks
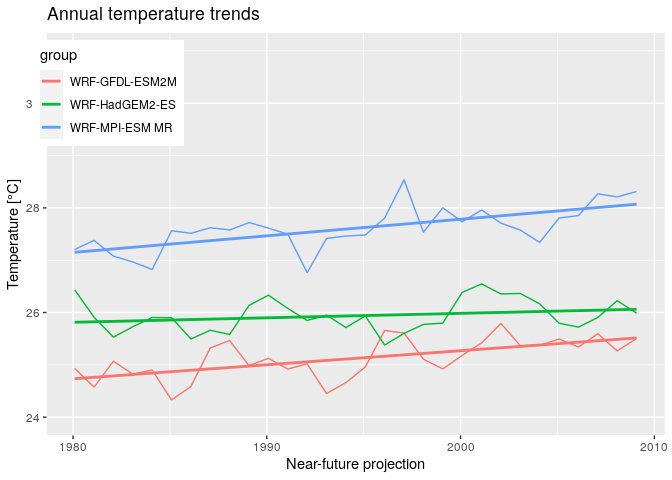
I can't work with your exact same code since you haven't provided a proper REPR oducible EX ample (reprex)
library(tidyverse)
library(lubridate)

url <- "https://drive.google.com/u/0/uc?id=16k1cMMr1dthJOsppazVZ3cUCa1rRGF9m&export=download"
nf <- read.csv(url)

nf %>%
    mutate_at(vars(starts_with("date")), as.Date) %>%
    select(date_mpi, mpi_tas, hadgem_tas, gfdl_tas) %>%
    gather(group, temperature, -date_mpi) %>%
    ggplot(aes(x = date_mpi, y = temperature, colour = group)) +
    geom_line() +
    geom_smooth(method = "lm", se=FALSE) +
    labs(title = "Annual temperature trends",
         x = "Near-future projection",
         y = "Temperature [°C]") +
    scale_y_continuous(limits = c(24,31)) +
    scale_color_discrete(labels = c("mpi_tas"='WRF-MPI-ESM MR',
                                    "hadgem_tas"='WRF-HadGEM2-ES',
                                    "gfdl_tas" ='WRF-GFDL-ESM2M')) +
    theme(legend.position = c(.1,.85))
#> `geom_smooth()` using formula 'y ~ x'
1 Like
Mawuli
April 9, 2020, 4:38pm
9
Andresrcs, you are a life saver. Thanks a lot.
system
April 30, 2020, 4:38pm
10
This topic was automatically closed 21 days after the last reply. New replies are no longer allowed.