I have to fit a Variance Gamma distribution to a data set (S&P500 returns), to find the 4 parameters of this distribution i have used the VarianceGamma package but i think that my results aren't correct.
library(VarianceGamma)
# import S&P500 prices from CSV
sp500prices <- read.csv("HistoricalDatasp500.csv")
# calculate the log return of S&P500
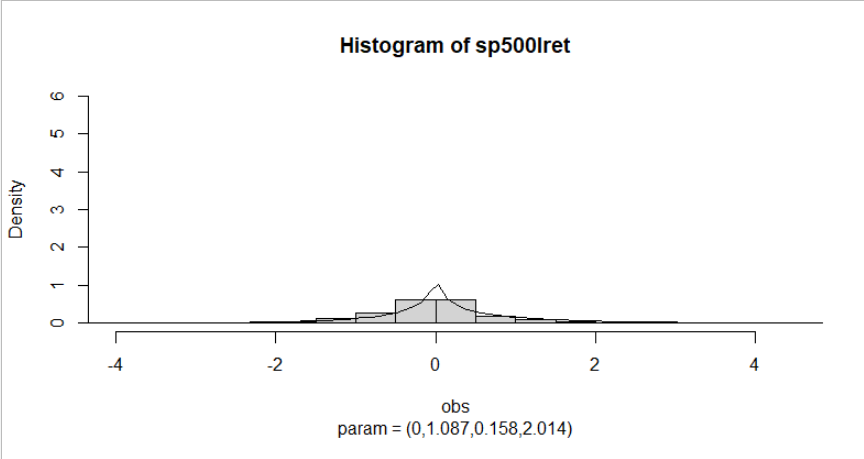
n <- nrow(sp500prices)
sp500lret <- log(sp500prices[2:n,2]/sp500prices[1:(n-1),2])
# fit the variance gamma distribution to the log return
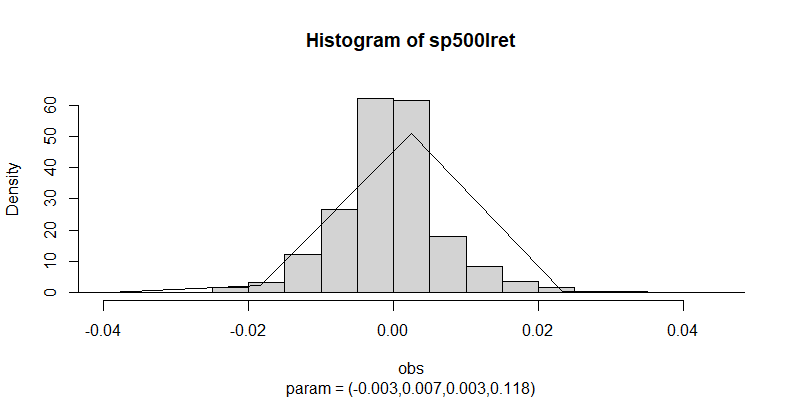
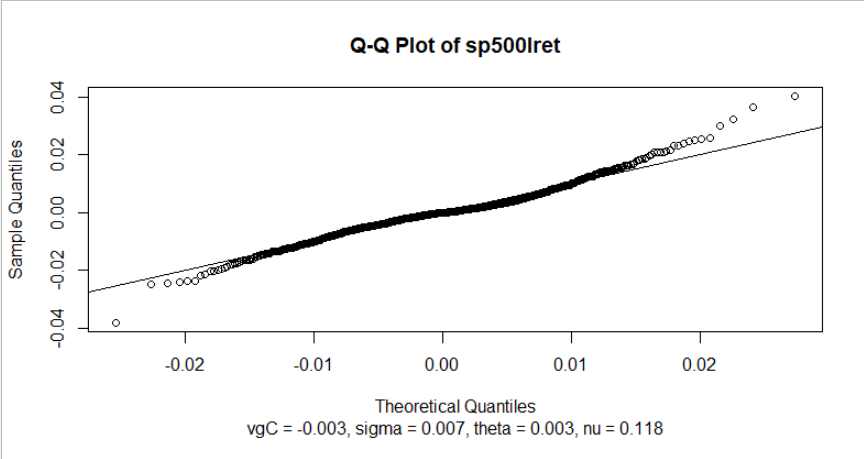
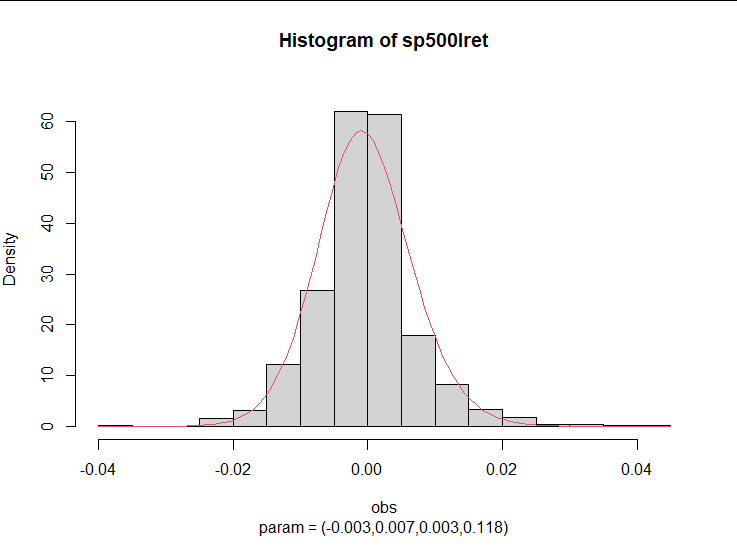
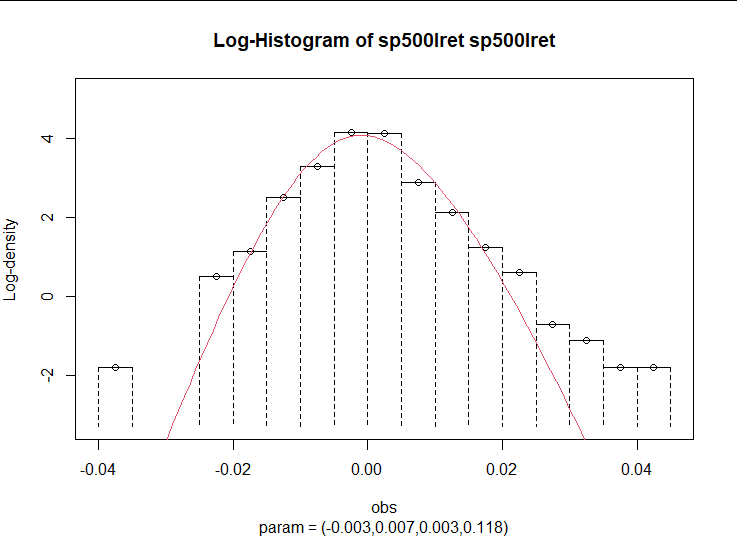
vgFit(sp500lret, plots = T)
As you can see in the image that the function vgFit outputs automatically the line is "broken" in several points (it dosent seem to be a probability density function of a variance gamma).
I have also tried the method of moments to find the starting parameter of the optimization but the function gives me error
I saw that other peoples have used the ghyp package but i do not know how to use it properly (not that I’m an expert on the VarianceGamma one) maybe someone can explain it in a simple way
Sorry, i have updated the code in the top section, but i still do not know ho to include the CSV directly in the code so i have uploaded the csv in google drive here is the link to download it
unless you have a problem with reading the csv, there is no gain to providing the csv.
you have issues manipulating sp500prices , so please, read the reprex guide, and consider how to provide sp500prices based on the advice within.
Sorry but the "reprex selection" returns:
<<Rendering reprex...
Error: This reprex appears to crash R
Call reprex() again with std_out_err = TRUE to get more info>>
anyway my problem isn't with sp500prices (that contains in order: date, close price, volume, open price, max price and min price) or with sp500lret (that contains the log return of the close price).
my problem is with the vgFit that returns, in my opinion wrong data and for sure wrong graph because that could be anything but a graph of a continuous distribution
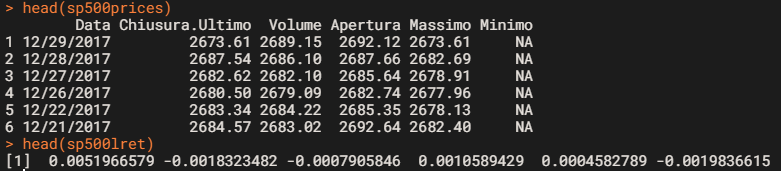
i have multiplied every log return by 100 and:
obviously the results of the vgFit are different and the new histogram with the density looks better but something withthe axes is wrong...
i can understand that the parameters of the veriance gamma are different but why the graph ? (obviously the axes are different but why the whole graph ?)
in your place I wouldnt multiply the logprice by 100, i would multiply the price by 100 to go from dollars to cents, and only then consider taking the log.
I am the developer (along with my student) of the package VarianceGamma. Unfortunately the graphics showing the fit of the variance gamma are a bit deficient, specifically the ones showing the histogram and log-histogram with added density. They were done many years ago and the fitted curves do not show the density and log-density appropriately.
I have updated those plots and uploaded a new version of the package to R-Forge, version 0.4-1. R-Forge takes some time to create the package, but here are the plots when the updated version is used. Note that the fit is the same, it is just the plots that have been revised.
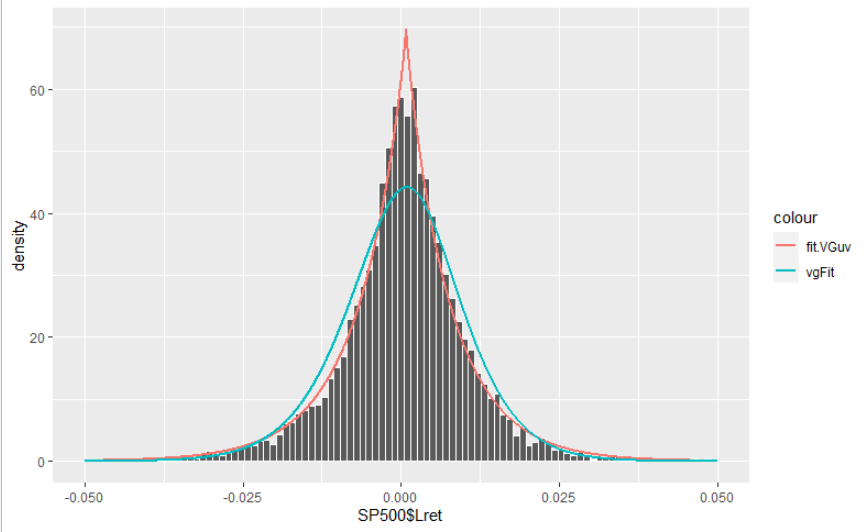
this is the code that i have used to fit and plot the distributions
library(ggplot2)
library(VarianceGamma)
library(ghyp)

SP500 <- read.csv("HistoricalPricesSP500.csv")
MySeq <- seq(-0.05, 0.05, length.out = 100000)

vg<-fit.VGuv(SP500$Lret)
fitDF_vg <- data.frame(x = MySeq,
                       y =  dghyp(MySeq, vg))

#the parameters are inputted manually because i havent found in time a way to imput the result of the vgFit (but they are exactly what the vgFit returns)
vgFit(SP500$Lret)
fitDF_vg1 <- data.frame(x = MySeq,
                        y =  dvg(MySeq, param = c(0.001855, 0.010035, -0.001496, 0.262822)))


#legend name
legenda <- c("fit.VGuv"="red", "vgFit"="blue")
#plot
ggplot(SP500, aes(x=SP500$Lret)) +
  geom_histogram(aes(y= stat(density)), bins = 100, color="white")+
  #vg plot
  geom_line(mapping = aes(x = x, y = y, col="fit.VGuv"), data = fitDF_vg, lwd=1) +
  geom_line(mapping = aes(x = x, y = y, col="vgFit"), data = fitDF_vg1, lwd=1)+
  xlim(-0.05,0.05)
As you can see the vg fitted with the VarrianceGamma package doesn't look good compared to the one found with the ghyp package. Do you know why? maybe there is an error in my code