Fit function in Tidymodels using workflows

I keep getting this error

Error in UseMethod("fit_xy") :
no applicable method for 'fit_xy' applied to an object of class "function"

with this code....

Put 3/4 of the data into the training set

data_split <- initial_split(org_data, prop = 3/4)

Create data frames for the two sets:

train_data <- training(data_split)
test_data <- testing(data_split)

#Start our Recipe

LifeExp_rec <-
recipe(Y ~ ., data = train_data) %>%
step_dummy(all_nominal_predictors()) %>%
step_zv(all_predictors()) %>%
step_center(all_predictors()) %>%
step_scale(all_predictors()) %>%
step_impute_knn(all_predictors(), neighbors = 3) %>%
step_select_vip(all_predictors(), outcome = "Y", model = linear_reg, top_p = 12, threshold = 0.7)
#prep()

LifeExp_rec

#Specific Model

linear_model<-
linear_reg() %>%
set_engine("lm") %>%
set_mode("regression") %>%
parsnip::translate()

linear_model

#Set up Work Flow with Recipe and model

LifeExp_wflow<-
workflow() %>%
add_recipe(LifeExp_rec) %>%
add_model(linear_model)

LifeExp_wflow

#Run work flow to Fit training data

LifeExp_fit<-
LifeExp_wflow %>%
fit(data=train_data)

LifeExp_fit

I am using the Kaggle CDC world Life Expectancy data

TDR

Hi,
I think you should remove the statement parsnip::translate() in the linear_model definition.
HTH

Thanks, but get the same error.

After removing and restarting Rstudio, same error.

Error in UseMethod("fit_xy") :
no applicable method for 'fit_xy' applied to an object of class "funct

In order to get help you should also provide the data, a sample at least, and the whole script.
Anyway I think the problem could be with the recipeselectors package.
Unfortunately I cannot load it, it is not available for my version of R.

The following library's are necessary

library(knitr)
library(rmarkdown)

library(kknn)
library(recipeselectors)
library(mice)
library(stats)
library(githubinstall)
library(xlsx)

library(tidymodels)
tidymodels_prefer(quiet = TRUE)

library(tidyverse)
library(conflicted)

#Set working directory
setwd("D:\PayStr\FindEngine\TidyModels\Data")

#Read in actual data set
org_data1 <- read.xlsx("Life Expectancy Data.xlsx", sheetIndex=1, header=TRUE, as.data.frame=TRUE)

#Dropping Country for now

org_data0<-org_data1%>%select(-Country)

org_data<-org_data0%>%filter(Y!=" ")

#Separating data into Training and Testing

set.seed(222)

Put 3/4 of the data into the training set

data_split <- initial_split(org_data, prop = 3/4)

Create data frames for the two sets:

train_data <- training(data_split)
test_data <- testing(data_split)

#Start our Recipe

LifeExp_rec <-
recipe(Y ~ ., data = train_data) %>%
step_dummy(all_nominal_predictors()) %>%
step_zv(all_predictors()) %>%
step_center(all_predictors()) %>%
step_scale(all_predictors()) %>%
step_impute_knn(all_predictors(), neighbors = 3) %>%
step_select_vip(all_predictors(), outcome = "Y", model = linear_reg, top_p = 12, threshold = 0.7)
#prep()

LifeExp_rec

#Specific Model

linear_model<-
linear_reg() %>%
set_engine("lm") %>%
set_mode("regression")

#parsnip::translate()

linear_model

#Set up Work Flow with Recipe and model

LifeExp_wflow<-
workflow() %>%
add_recipe(LifeExp_rec) %>%
add_model(linear_model)

LifeExp_wflow

#Run work flow to Fit training data

LifeExp_fit<-
LifeExp_wflow %>%
fit(data=train_data)

LifeExp_fit

#Extract parameters from Fit

LifeExp_fit %>%
extract_fit_parsnip() %>%
tidy()

#Residual analysis

Life_Exp_aug<-
augment(LifeExp_fit, train_data)

Life_Exp_aug$.resid=(Life_Exp_aug$Y-Life_Exp_aug$.pred)

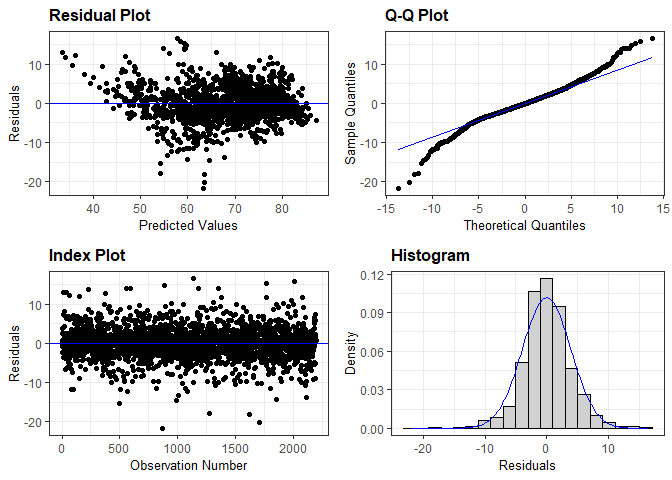
resid_auxpanel(Life_Exp_aug$.resid, Life_Exp_aug$.pred, bins = 20)

#Measures of model fit on Training data

Life_Exp_TR_P<-predict(LifeExp_fit,new_data = train_data)

Life_Exp_RMSE_TR<-bind_cols(Life_Exp_TR_P, train_data %>% select(Y))

Life_Exp_Metrics <-metric_set(rmse, rsq, mae)

Life_Exp_Metrics(Life_Exp_RMSE_TR, truth=Y, estimate=.pred)

#Variable Importance

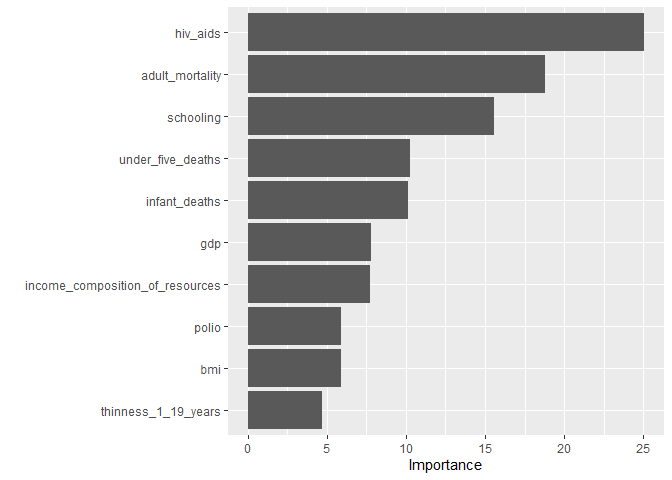
LifeExp_fit %>%
extract_fit_parsnip() %>%
vip(method = "model",
target = "Y", metric = "rmse",
pred_wrapper = stats::predict, train = train_data)

#Measures of model fit on Test data

Life_Exp_TT_P<-predict(LifeExp_fit, new_data = test_data)

Life_Exp_RMSE_TT<-bind_cols(Life_Exp_TT_P, test_data %>% select(Y))

Life_Exp_Metrics <-metric_set(rmse, rsq, mae)

Life_Exp_Metrics(Life_Exp_RMSE_TT, truth=Y, estimate=.pred)

#K-fold Cross validation

set.seed(1001)

Life_Exp_folds<- vfold_cv(train_data, v=10)
Life_Exp_folds

#Setting some resampling controls
keep_pred <-control_resamples(save_pred=TRUE, save_workflow= TRUE)

set.seed(1003)

#Fitting the resampled data
Life_Exp_Res<-
LifeExp_wflow %>%
fit_resamples(resamples=Life_Exp_folds, control=keep_pred)

Life_Exp_Res

#Collecting Metrics

collect_metrics(Life_Exp_Res)

#Output the assessment predictions for plotting

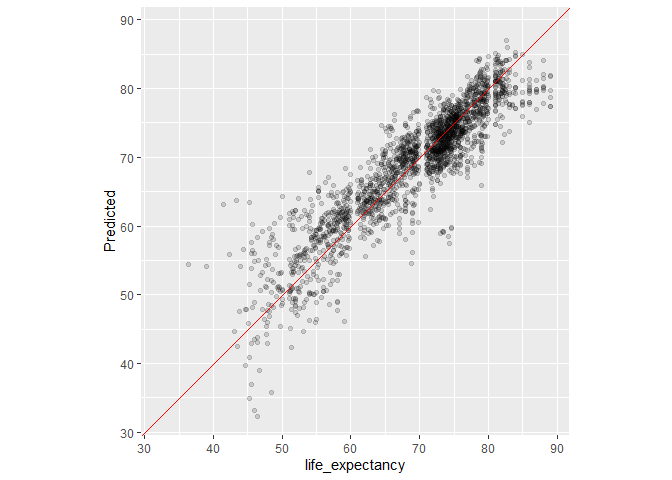
assess_res<-collect_predictions(Life_Exp_Res)
assess_res

assess_res %>%
ggplot(aes(x = Y, y = .pred)) +
geom_point(alpha = .15) +
geom_abline(color = "red") +
coord_obs_pred() +
ylab("Predicted")
data

I was able to run all the script without this statement.

You should open an issue on github to the recipeselector package.

HTH

Yes, it did the same for me (after adding back in some library's I missed)...But, the question remains. I was developing this as an example of best practices for building and assessing a single regression type model using Tidymodels workflows. I am sure some folks would prefer using the Feature Selection out side of the workflow and done in a previous step. It seems like for consistency sake during deployment it would be best to be inside the work flow. So, what is the right feature selection tool in Tidymodels for use inside the workflow?

Currently there is not any supervised feature selection step implemented in tidymodels.
As far as I know, it is a development priority for 2022 (Priorities for tidymodels 2022).

Anyway, I finally managed to run the feature selection inside the workflow.
For the linear model coefficients you should use
step_select_linear(all_predictors(), outcome = "life_expectancy", top_p = 12)

By the way, note that threshold overrides top_p parameter.

library(tidymodels)
tidymodels_prefer(quiet = TRUE)

library(recipeselectors)

library(tidyverse)
library(conflicted)

library(here)
#> here() starts at D:/ML/Projects/Community-RStudio
library(janitor)

#Read in actual data set

# org_data1 <- read.xlsx("Life Expectancy Data.xlsx", sheetIndex=1, header=TRUE, as.data.frame=TRUE)

org_data1 <- read_csv(here("fit-function-in-tidymodels-using-workflow", "Life Expectancy Data.csv")) %>%
    clean_names()
#> Rows: 2938 Columns: 22
#> -- Column specification --------------------------------------------------------
#> Delimiter: ","
#> chr  (2): Country, Status
#> dbl (20): Year, Life expectancy, Adult Mortality, infant deaths, Alcohol, pe...
#> 
#> i Use `spec()` to retrieve the full column specification for this data.
#> i Specify the column types or set `show_col_types = FALSE` to quiet this message.

#Dropping Country for now
org_data0 <- org_data1 %>% select(-country)

org_data <- org_data0 %>% drop_na(life_expectancy) # filter(Y != " ")

#Separating data into Training and Testing

set.seed(222)

# Put 3/4 of the data into the training set
data_split <- initial_split(org_data, prop = 3/4)

# Create data frames for the two sets:
train_data <- training(data_split)
test_data <- testing(data_split)

#Start our Recipe

LifeExp_rec <-
    recipe(life_expectancy ~ ., data = train_data) %>%
    step_dummy(all_nominal_predictors()) %>%
    step_zv(all_predictors()) %>%
    step_center(all_predictors()) %>%
    step_scale(all_predictors()) %>%
    step_impute_knn(all_predictors(), neighbors = 3) %>%
    step_select_linear(all_predictors(), outcome = "life_expectancy", top_p = 12)
    # step_select_vip(all_predictors(), outcome = "Y", model = linear_reg, top_p = 12, threshold = 0.7)
#prep()

LifeExp_rec
#> Recipe
#> 
#> Inputs:
#> 
#>       role #variables
#>    outcome          1
#>  predictor         20
#> 
#> Operations:
#> 
#> Dummy variables from all_nominal_predictors()
#> Zero variance filter on all_predictors()
#> Centering for all_predictors()
#> Scaling for all_predictors()
#> K-nearest neighbor imputation for all_predictors()
#> Variable importance feature selection

#Specific Model

linear_model <-
    linear_reg() %>%
    set_engine("lm") %>%
    set_mode("regression")

#parsnip::translate()

linear_model
#> Linear Regression Model Specification (regression)
#> 
#> Computational engine: lm

#Set up Work Flow with Recipe and model

LifeExp_wflow <-
    workflow() %>%
    add_recipe(LifeExp_rec) %>%
    add_model(linear_model)

LifeExp_wflow
#> == Workflow ====================================================================
#> Preprocessor: Recipe
#> Model: linear_reg()
#> 
#> -- Preprocessor ----------------------------------------------------------------
#> 6 Recipe Steps
#> 
#> * step_dummy()
#> * step_zv()
#> * step_center()
#> * step_scale()
#> * step_impute_knn()
#> * step_select_linear()
#> 
#> -- Model -----------------------------------------------------------------------
#> Linear Regression Model Specification (regression)
#> 
#> Computational engine: lm

#Run work flow to Fit training data

LifeExp_fit <-
    LifeExp_wflow %>%
    fit(data = train_data)

LifeExp_fit
#> == Workflow [trained] ==========================================================
#> Preprocessor: Recipe
#> Model: linear_reg()
#> 
#> -- Preprocessor ----------------------------------------------------------------
#> 6 Recipe Steps
#> 
#> * step_dummy()
#> * step_zv()
#> * step_center()
#> * step_scale()
#> * step_impute_knn()
#> * step_select_linear()
#> 
#> -- Model -----------------------------------------------------------------------
#> 
#> Call:
#> stats::lm(formula = ..y ~ ., data = data)
#> 
#> Coefficients:
#>                     (Intercept)                  adult_mortality  
#>                         69.3465                          -2.1216  
#>                   infant_deaths                              bmi  
#>                         11.4291                           0.6548  
#>               under_five_deaths                            polio  
#>                        -11.5836                           0.6933  
#>                      diphtheria                         hiv_aids  
#>                          0.5081                          -2.4761  
#>                             gdp              thinness_1_19_years  
#>                          0.8397                          -0.5504  
#> income_composition_of_resources                        schooling  
#>                          1.1467                           2.3786  
#>               status_Developing  
#>                         -0.4840

#Extract parameters from Fit

LifeExp_fit %>%
    extract_fit_parsnip() %>%
    tidy()
#> # A tibble: 13 x 5
#>    term                            estimate std.error statistic   p.value
#>    <chr>                              <dbl>     <dbl>     <dbl>     <dbl>
#>  1 (Intercept)                       69.3      0.0841    824.   0        
#>  2 adult_mortality                   -2.12     0.113     -18.8  5.90e- 73
#>  3 infant_deaths                     11.4      1.13       10.1  1.44e- 23
#>  4 bmi                                0.655    0.111       5.88 4.78e-  9
#>  5 under_five_deaths                -11.6      1.13      -10.2  4.89e- 24
#>  6 polio                              0.693    0.118       5.90 4.24e-  9
#>  7 diphtheria                         0.508    0.120       4.25 2.27e-  5
#>  8 hiv_aids                          -2.48     0.0987    -25.1  3.34e-122
#>  9 gdp                                0.840    0.108       7.79 1.01e- 14
#> 10 thinness_1_19_years               -0.550    0.117      -4.72 2.52e-  6
#> 11 income_composition_of_resources    1.15     0.149       7.70 2.04e- 14
#> 12 schooling                          2.38     0.153      15.6  7.72e- 52
#> 13 status_Developing                 -0.484    0.106      -4.55 5.70e-  6

#Residual analysis

Life_Exp_aug <-
    augment(LifeExp_fit, train_data)

Life_Exp_aug$.resid <- (Life_Exp_aug$life_expectancy - Life_Exp_aug$.pred)

ggResidpanel::resid_auxpanel(Life_Exp_aug$.resid, Life_Exp_aug$.pred, bins = 20)

#Measures of model fit on Training data

Life_Exp_TR_P <- predict(LifeExp_fit,new_data = train_data)

Life_Exp_RMSE_TR <- bind_cols(Life_Exp_TR_P, train_data %>% select(life_expectancy))

Life_Exp_Metrics <- metric_set(rmse, rsq, mae)

Life_Exp_Metrics(Life_Exp_RMSE_TR, truth = life_expectancy, estimate = .pred)
#> # A tibble: 3 x 3
#>   .metric .estimator .estimate
#>   <chr>   <chr>          <dbl>
#> 1 rmse    standard       3.92 
#> 2 rsq     standard       0.827
#> 3 mae     standard       2.91

#Variable Importance
LifeExp_fit %>%
    extract_fit_parsnip() %>%
    vip::vip(method = "model",
        target = "life_expectancy", metric = "rmse",
        pred_wrapper = stats::predict, train = train_data)

#Measures of model fit on Test data

Life_Exp_TT_P <- predict(LifeExp_fit, new_data = test_data)

Life_Exp_RMSE_TT <- bind_cols(Life_Exp_TT_P, test_data %>% select(life_expectancy))

Life_Exp_Metrics <- metric_set(rmse, rsq, mae)

Life_Exp_Metrics(Life_Exp_RMSE_TT, truth = life_expectancy, estimate = .pred)
#> # A tibble: 3 x 3
#>   .metric .estimator .estimate
#>   <chr>   <chr>          <dbl>
#> 1 rmse    standard       3.99 
#> 2 rsq     standard       0.835
#> 3 mae     standard       3.03

#K-fold Cross validation

set.seed(1001)

Life_Exp_folds <- vfold_cv(train_data, v = 10)
Life_Exp_folds
#> #  10-fold cross-validation 
#> # A tibble: 10 x 2
#>    splits             id    
#>    <list>             <chr> 
#>  1 <split [1976/220]> Fold01
#>  2 <split [1976/220]> Fold02
#>  3 <split [1976/220]> Fold03
#>  4 <split [1976/220]> Fold04
#>  5 <split [1976/220]> Fold05
#>  6 <split [1976/220]> Fold06
#>  7 <split [1977/219]> Fold07
#>  8 <split [1977/219]> Fold08
#>  9 <split [1977/219]> Fold09
#> 10 <split [1977/219]> Fold10

#Setting some resampling controls
keep_pred <- control_resamples(save_pred = TRUE, save_workflow = TRUE)

set.seed(1003)

#Fitting the resampled data
Life_Exp_Res <-
    LifeExp_wflow %>%
    fit_resamples(resamples = Life_Exp_folds, control = keep_pred)

Life_Exp_Res
#> # Resampling results
#> # 10-fold cross-validation 
#> # A tibble: 10 x 5
#>    splits             id     .metrics         .notes           .predictions
#>    <list>             <chr>  <list>           <list>           <list>      
#>  1 <split [1976/220]> Fold01 <tibble [2 x 4]> <tibble [0 x 3]> <tibble>    
#>  2 <split [1976/220]> Fold02 <tibble [2 x 4]> <tibble [0 x 3]> <tibble>    
#>  3 <split [1976/220]> Fold03 <tibble [2 x 4]> <tibble [0 x 3]> <tibble>    
#>  4 <split [1976/220]> Fold04 <tibble [2 x 4]> <tibble [0 x 3]> <tibble>    
#>  5 <split [1976/220]> Fold05 <tibble [2 x 4]> <tibble [0 x 3]> <tibble>    
#>  6 <split [1976/220]> Fold06 <tibble [2 x 4]> <tibble [0 x 3]> <tibble>    
#>  7 <split [1977/219]> Fold07 <tibble [2 x 4]> <tibble [0 x 3]> <tibble>    
#>  8 <split [1977/219]> Fold08 <tibble [2 x 4]> <tibble [0 x 3]> <tibble>    
#>  9 <split [1977/219]> Fold09 <tibble [2 x 4]> <tibble [0 x 3]> <tibble>    
#> 10 <split [1977/219]> Fold10 <tibble [2 x 4]> <tibble [0 x 3]> <tibble>

#Collecting Metrics

collect_metrics(Life_Exp_Res)
#> # A tibble: 2 x 6
#>   .metric .estimator  mean     n std_err .config             
#>   <chr>   <chr>      <dbl> <int>   <dbl> <chr>               
#> 1 rmse    standard   3.95     10 0.0869  Preprocessor1_Model1
#> 2 rsq     standard   0.826    10 0.00772 Preprocessor1_Model1

#Output the assessment predictions for plotting

assess_res <- collect_predictions(Life_Exp_Res)
assess_res
#> # A tibble: 2,196 x 5
#>    id     .pred  .row life_expectancy .config             
#>    <chr>  <dbl> <int>           <dbl> <chr>               
#>  1 Fold01  67.5    10            63.5 Preprocessor1_Model1
#>  2 Fold01  64.9    27            58.1 Preprocessor1_Model1
#>  3 Fold01  64.9    46            58.7 Preprocessor1_Model1
#>  4 Fold01  55.9    50            58.6 Preprocessor1_Model1
#>  5 Fold01  71.3    57            72.2 Preprocessor1_Model1
#>  6 Fold01  84.6    61            81.3 Preprocessor1_Model1
#>  7 Fold01  79.5    63            82   Preprocessor1_Model1
#>  8 Fold01  50.5    64            49.8 Preprocessor1_Model1
#>  9 Fold01  63.7    65            63.5 Preprocessor1_Model1
#> 10 Fold01  74.3    67            73.6 Preprocessor1_Model1
#> # ... with 2,186 more rows

assess_res %>%
    ggplot(aes(x = life_expectancy, y = .pred)) +
    geom_point(alpha = .15) +
    geom_abline(color = "red") +
    coord_obs_pred() +
    ylab("Predicted")
Created on 2022-04-21 by the reprex package (v2.0.1)

Session info
sessioninfo::session_info()
#> - Session info ---------------------------------------------------------------
#>  setting  value
#>  version  R version 4.1.3 (2022-03-10)
#>  os       Windows 10 x64 (build 19044)
#>  system   x86_64, mingw32
#>  ui       RTerm
#>  language (EN)
#>  collate  English_United Kingdom.1252
#>  ctype    English_United Kingdom.1252
#>  tz       Europe/Berlin
#>  date     2022-04-21
#>  pandoc   2.17.1.1 @ C:/Program Files/RStudio/bin/quarto/bin/ (via rmarkdown)
#> 
#> - Packages -------------------------------------------------------------------
#>  package         * version    date (UTC) lib source
#>  assertthat        0.2.1      2019-03-21 [1] CRAN (R 4.1.0)
#>  backports         1.4.1      2021-12-13 [1] CRAN (R 4.1.2)
#>  bit               4.0.4      2020-08-04 [1] CRAN (R 4.1.0)
#>  bit64             4.0.5      2020-08-30 [1] CRAN (R 4.1.0)
#>  broom           * 0.8.0      2022-04-13 [1] CRAN (R 4.1.3)
#>  cachem            1.0.6      2021-08-19 [1] CRAN (R 4.1.1)
#>  cellranger        1.1.0      2016-07-27 [1] CRAN (R 4.1.0)
#>  class             7.3-20     2022-01-16 [2] CRAN (R 4.1.3)
#>  cli               3.2.0      2022-02-14 [1] CRAN (R 4.1.2)
#>  codetools         0.2-18     2020-11-04 [2] CRAN (R 4.1.3)
#>  colorspace        2.0-3      2022-02-21 [1] CRAN (R 4.1.2)
#>  conflicted      * 1.1.0      2021-11-26 [1] CRAN (R 4.1.1)
#>  cowplot           1.1.1      2020-12-30 [1] CRAN (R 4.1.0)
#>  crayon            1.5.1      2022-03-26 [1] CRAN (R 4.1.3)
#>  curl              4.3.2      2021-06-23 [1] CRAN (R 4.1.0)
#>  data.table        1.14.2     2021-09-27 [1] CRAN (R 4.1.1)
#>  DBI               1.1.2      2021-12-20 [1] CRAN (R 4.1.2)
#>  dbplyr            2.1.1      2021-04-06 [1] CRAN (R 4.1.0)
#>  DEoptimR          1.0-11     2022-04-03 [1] CRAN (R 4.1.3)
#>  dials           * 0.1.1      2022-04-06 [1] CRAN (R 4.1.3)
#>  DiceDesign        1.9        2021-02-13 [1] CRAN (R 4.1.0)
#>  digest            0.6.29     2021-12-01 [1] CRAN (R 4.1.2)
#>  dplyr           * 1.0.8      2022-02-08 [1] CRAN (R 4.1.2)
#>  ellipsis          0.3.2      2021-04-29 [1] CRAN (R 4.1.0)
#>  evaluate          0.15       2022-02-18 [1] CRAN (R 4.1.2)
#>  fansi             1.0.3      2022-03-24 [1] CRAN (R 4.1.3)
#>  farver            2.1.0      2021-02-28 [1] CRAN (R 4.1.0)
#>  fastmap           1.1.0      2021-01-25 [1] CRAN (R 4.1.0)
#>  forcats         * 0.5.1      2021-01-27 [1] CRAN (R 4.1.0)
#>  foreach           1.5.2      2022-02-02 [1] CRAN (R 4.1.2)
#>  fs                1.5.2      2021-12-08 [1] CRAN (R 4.1.2)
#>  furrr             0.2.3      2021-06-25 [1] CRAN (R 4.1.0)
#>  future            1.24.0     2022-02-19 [1] CRAN (R 4.1.2)
#>  future.apply      1.8.1      2021-08-10 [1] CRAN (R 4.1.0)
#>  generics          0.1.2      2022-01-31 [1] CRAN (R 4.1.2)
#>  ggplot2         * 3.3.5      2021-06-25 [1] CRAN (R 4.1.0)
#>  ggResidpanel      0.3.0      2019-05-31 [1] CRAN (R 4.1.3)
#>  globals           0.14.0     2020-11-22 [1] CRAN (R 4.1.0)
#>  glue              1.6.2      2022-02-24 [1] CRAN (R 4.1.2)
#>  gower             1.0.0      2022-02-03 [1] CRAN (R 4.1.2)
#>  GPfit             1.0-8      2019-02-08 [1] CRAN (R 4.1.0)
#>  gridExtra         2.3        2017-09-09 [1] CRAN (R 4.1.0)
#>  gtable            0.3.0      2019-03-25 [1] CRAN (R 4.1.0)
#>  hardhat           0.2.0      2022-01-24 [1] CRAN (R 4.1.2)
#>  haven             2.5.0      2022-04-15 [1] CRAN (R 4.1.3)
#>  here            * 1.0.1      2020-12-13 [1] CRAN (R 4.1.0)
#>  highr             0.9        2021-04-16 [1] CRAN (R 4.1.0)
#>  hms               1.1.1      2021-09-26 [1] CRAN (R 4.1.1)
#>  htmltools         0.5.2      2021-08-25 [1] CRAN (R 4.1.1)
#>  htmlwidgets       1.5.4      2021-09-08 [1] CRAN (R 4.1.1)
#>  httr              1.4.2      2020-07-20 [1] CRAN (R 4.1.0)
#>  infer           * 1.0.0      2021-08-13 [1] CRAN (R 4.1.0)
#>  ipred             0.9-12     2021-09-15 [1] CRAN (R 4.1.1)
#>  iterators         1.0.14     2022-02-05 [1] CRAN (R 4.1.2)
#>  janitor         * 2.1.0      2021-01-05 [1] CRAN (R 4.1.0)
#>  jsonlite          1.8.0      2022-02-22 [1] CRAN (R 4.1.2)
#>  knitr             1.38       2022-03-25 [1] CRAN (R 4.1.3)
#>  labeling          0.4.2      2020-10-20 [1] CRAN (R 4.1.0)
#>  lattice           0.20-45    2021-09-22 [2] CRAN (R 4.1.3)
#>  lava              1.6.10     2021-09-02 [1] CRAN (R 4.1.1)
#>  lazyeval          0.2.2      2019-03-15 [1] CRAN (R 4.1.0)
#>  lhs               1.1.5      2022-03-22 [1] CRAN (R 4.1.2)
#>  lifecycle         1.0.1      2021-09-24 [1] CRAN (R 4.1.1)
#>  listenv           0.8.0      2019-12-05 [1] CRAN (R 4.1.0)
#>  lubridate         1.8.0      2021-10-07 [1] CRAN (R 4.1.1)
#>  magrittr          2.0.3      2022-03-30 [1] CRAN (R 4.1.3)
#>  MASS              7.3-56     2022-03-23 [1] CRAN (R 4.1.3)
#>  Matrix            1.4-1      2022-03-23 [1] CRAN (R 4.1.3)
#>  memoise           2.0.1      2021-11-26 [1] CRAN (R 4.1.1)
#>  mime              0.12       2021-09-28 [1] CRAN (R 4.1.1)
#>  modeldata       * 0.1.1      2021-07-14 [1] CRAN (R 4.1.0)
#>  modelr            0.1.8      2020-05-19 [1] CRAN (R 4.1.0)
#>  munsell           0.5.0      2018-06-12 [1] CRAN (R 4.1.0)
#>  nnet              7.3-17     2022-01-16 [2] CRAN (R 4.1.3)
#>  parallelly        1.31.0     2022-04-07 [1] CRAN (R 4.1.3)
#>  parsnip         * 0.2.1      2022-03-17 [1] CRAN (R 4.1.2)
#>  pillar            1.7.0      2022-02-01 [1] CRAN (R 4.1.2)
#>  pkgconfig         2.0.3      2019-09-22 [1] CRAN (R 4.1.0)
#>  plotly            4.10.0     2021-10-09 [1] CRAN (R 4.1.1)
#>  plyr              1.8.7      2022-03-24 [1] CRAN (R 4.1.3)
#>  pROC              1.18.0     2021-09-03 [1] CRAN (R 4.1.1)
#>  prodlim           2019.11.13 2019-11-17 [1] CRAN (R 4.1.0)
#>  purrr           * 0.3.4      2020-04-17 [1] CRAN (R 4.1.2)
#>  qqplotr           0.0.5      2021-04-23 [1] CRAN (R 4.1.0)
#>  R.cache           0.15.0     2021-04-30 [1] CRAN (R 4.1.0)
#>  R.methodsS3       1.8.1      2020-08-26 [1] CRAN (R 4.1.0)
#>  R.oo              1.24.0     2020-08-26 [1] CRAN (R 4.1.0)
#>  R.utils           2.11.0     2021-09-26 [1] CRAN (R 4.1.1)
#>  R6                2.5.1      2021-08-19 [1] CRAN (R 4.1.1)
#>  Rcpp              1.0.8.3    2022-03-17 [1] CRAN (R 4.1.2)
#>  readr           * 2.1.2      2022-01-30 [1] CRAN (R 4.1.2)
#>  readxl            1.4.0      2022-03-28 [1] CRAN (R 4.1.3)
#>  recipes         * 0.2.0      2022-02-18 [1] CRAN (R 4.1.2)
#>  recipeselectors * 0.0.1      2022-04-18 [1] Github (stevenpawley/recipeselectors@5949fab)
#>  reprex            2.0.1      2021-08-05 [1] CRAN (R 4.1.0)
#>  rlang             1.0.2      2022-03-04 [1] CRAN (R 4.1.2)
#>  rmarkdown         2.13       2022-03-10 [1] CRAN (R 4.1.3)
#>  robustbase        0.95-0     2022-04-02 [1] CRAN (R 4.1.3)
#>  rpart             4.1.16     2022-01-24 [2] CRAN (R 4.1.3)
#>  rprojroot         2.0.3      2022-04-02 [1] CRAN (R 4.1.3)
#>  rsample         * 0.1.1      2021-11-08 [1] CRAN (R 4.1.1)
#>  rstudioapi        0.13       2020-11-12 [1] CRAN (R 4.1.0)
#>  rvest             1.0.2      2021-10-16 [1] CRAN (R 4.1.1)
#>  scales          * 1.2.0      2022-04-13 [1] CRAN (R 4.1.3)
#>  sessioninfo       1.2.2      2021-12-06 [1] CRAN (R 4.1.2)
#>  snakecase         0.11.0     2019-05-25 [1] CRAN (R 4.1.0)
#>  stringi           1.7.6      2021-11-29 [1] CRAN (R 4.1.1)
#>  stringr         * 1.4.0      2019-02-10 [1] CRAN (R 4.1.0)
#>  styler            1.7.0      2022-03-13 [1] CRAN (R 4.1.2)
#>  survival          3.3-1      2022-03-03 [1] CRAN (R 4.1.2)
#>  tibble          * 3.1.6      2021-11-07 [1] CRAN (R 4.1.1)
#>  tidymodels      * 0.2.0      2022-03-19 [1] CRAN (R 4.1.2)
#>  tidyr           * 1.2.0      2022-02-01 [1] CRAN (R 4.1.2)
#>  tidyselect        1.1.2      2022-02-21 [1] CRAN (R 4.1.2)
#>  tidyverse       * 1.3.1      2021-04-15 [1] CRAN (R 4.1.0)
#>  timeDate          3043.102   2018-02-21 [1] CRAN (R 4.1.0)
#>  tune            * 0.2.0      2022-03-19 [1] CRAN (R 4.1.2)
#>  tzdb              0.3.0      2022-03-28 [1] CRAN (R 4.1.3)
#>  utf8              1.2.2      2021-07-24 [1] CRAN (R 4.1.0)
#>  vctrs             0.4.1      2022-04-13 [1] CRAN (R 4.1.3)
#>  vip               0.3.2      2020-12-17 [1] CRAN (R 4.1.0)
#>  viridisLite       0.4.0      2021-04-13 [1] CRAN (R 4.1.0)
#>  vroom             1.5.7      2021-11-30 [1] CRAN (R 4.1.2)
#>  withr             2.5.0      2022-03-03 [1] CRAN (R 4.1.2)
#>  workflows       * 0.2.6      2022-03-18 [1] CRAN (R 4.1.2)
#>  workflowsets    * 0.2.1      2022-03-15 [1] CRAN (R 4.1.2)
#>  xfun              0.30       2022-03-02 [1] CRAN (R 4.1.2)
#>  xml2              1.3.3      2021-11-30 [1] CRAN (R 4.1.2)
#>  yaml              2.3.5      2022-02-21 [1] CRAN (R 4.1.2)
#>  yardstick       * 0.0.9      2021-11-22 [1] CRAN (R 4.1.1)
#> 
#>  [1] D:/R/library
#>  [2] C:/Program Files/R/R-4.1.3/library
#> 
#> ------------------------------------------------------------------------------

I was developing this as an example of best practices for building and assessing a single regression type model using Tidymodels workflows.. .

This topic was automatically closed 21 days after the last reply. New replies are no longer allowed.

If you have a query related to it or one of the replies, start a new topic and refer back with a link.