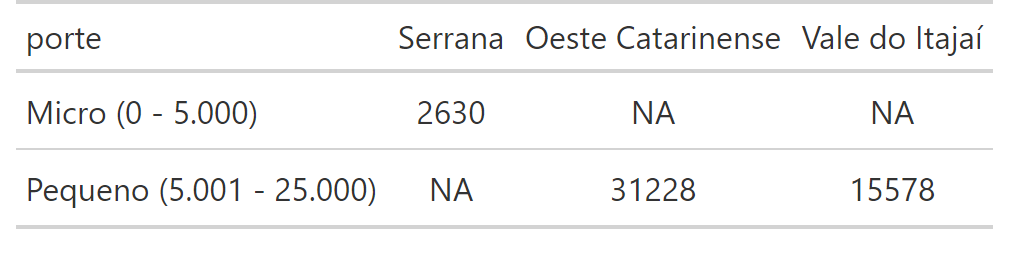
I want to create a gt table so that the values of one variable (meso) are the columns and the rows of the table represent the frequency of factor levels from a different variable (porte) . Here is a reprex:
df <- tibble::tribble(
                    ~pop,                     ~porte,               ~meso,
                   2630L,        "Micro (0 - 5.000)",           "Serrana",
                  17717L, "Pequeno (5.001 - 25.000)", "Oeste Catarinense",
                  10272L, "Pequeno (5.001 - 25.000)",    "Vale do Itajaí",
                   5306L, "Pequeno (5.001 - 25.000)",    "Vale do Itajaí",
                   7132L, "Pequeno (5.001 - 25.000)", "Oeste Catarinense",
                   6379L, "Pequeno (5.001 - 25.000)", "Oeste Catarinense"
                  )

#At first I tried this:

df %>%
  select(meso, porte) %>%
  pivot_wider(
    names_from = meso,
    values_from = porte,
    values_fn = list(porte = length))  %>%
  gt()

#But I only got the total number of observations for each column ungrouped

#Then I tried this:

df %>%
  group_by(meso,porte) %>%
  summarize(sum=n()) %>%
  pivot_wider(id_cols="meso",names_from="meso",values_from="sum") %>%
  gt()

#This time around, the values were grouped
#but all contained within a single row (for example: col1 = "Grande Florianopolis", row1 = 3, 3, 5, 10)
Does anyone have any clue of how I can create a row for each factor so that my table looks something like this?
PORTE| G.F | N.C | S.R |
micro | 5| 10| 2|
pequeno| 2|3|5|
medio|1|2|4
grande|5|6|7