Filtering Data by Area in a Plot

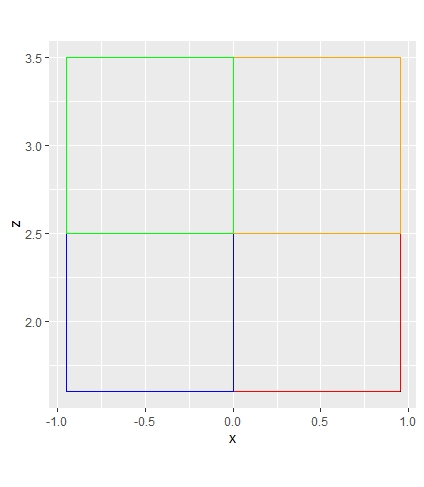
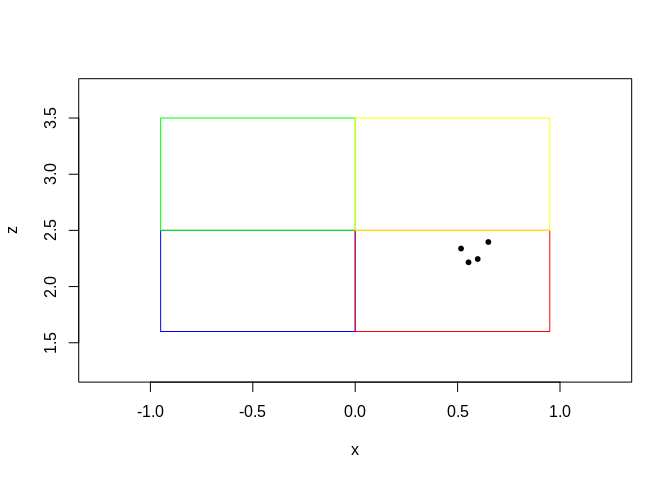
Hi, I was wondering if there is a way to filter my data by a specific region of points. So, in the picture I have below, I would like to see just the points that are in the red region (down_in). Thank you!

yelich <- data.frame(
plate_x = c(-0.4895, -0.5197, 0.5169, 1.1077, 1.3299, 0.1347, 1.3979,
-0.2142, 0.5982, -0.5614, 0.6501, 0.3105, 1.2385, 0.2096,
0.48, 0.5458, -0.7775, -0.9248, 1.4628, 1.2406, -0.1379, -0.2188,
-0.7861, -2.4055, -0.2201, -0.9993, 0.5534, 1.8461, -0.2148,
-0.0624),
plate_z = c(3.8125, 2.6877, 2.3384, 1.8482, 1.2539, 1.4041, 2.7248,
2.2688, 2.2451, 1.7012, 2.3968, 0.9775, 2.7827, 3.2931,
0.6966, 3.6894, 2.3352, 1.8292, 2.5673, 2.8705, 1.4959, 1.9526,
-0.6215, 1.5998, 1.9236, 0.7451, 2.2158, 2.189, -0.0983, 1.4302)
)

down_in_x <- c(.95,0, 0, .95, .95)
down_in_y <- c(1.6, 1.6, 2.5, 2.5, 1.6)
down_in <- data.frame(down_in_x, down_in_y)

down_out_x <- c(-.95,-.95, 0, 0, -.95)
down_out_y <- c(1.6, 2.5, 2.5, 1.6, 1.6)
down_out <- data.frame(down_out_x, down_out_y)

up_in_x <- c(0,0,.95,.95,0)
up_in_y <- c(2.5,3.5,3.5,2.5,2.5)
up_in <- data.frame(up_in_x, up_in_y)

up_out_x <- c(0,0,-.95, -.95, 0)
up_out_y <- c(2.5,3.5,3.5, 2.5, 2.5)
up_out <- data.frame(up_out_x, up_out_y)

strikezone

If you are OK with base graphics, then you can use clip:

yelich <- data.frame(plate_x = c(-0.4895, -0.5197, 0.5169, 1.1077, 1.3299, 0.1347,
                                 1.3979, -0.2142, 0.5982, -0.5614, 0.6501, 0.3105,
                                 1.2385, 0.2096, 0.48, 0.5458, -0.7775, -0.9248,
                                 1.4628, 1.2406, -0.1379, -0.2188, -0.7861, -2.4055,
                                 -0.2201, -0.9993, 0.5534, 1.8461, -0.2148, -0.0624),
                     plate_z = c(3.8125, 2.6877, 2.3384, 1.8482, 1.2539, 1.4041,
                                 2.7248, 2.2688, 2.2451, 1.7012, 2.3968, 0.9775,
                                 2.7827, 3.2931, 0.6966, 3.6894, 2.3352, 1.8292,
                                 2.5673, 2.8705, 1.4959, 1.9526, -0.6215, 1.5998,
                                 1.9236, 0.7451, 2.2158, 2.189, -0.0983, 1.4302))

plot(x = yelich,
     type = "n",
     xlab = "x",
     ylab = "z",
     xlim = c(-1.25, 1.25),
     ylim = c(1.25, 3.75))

rect(xleft = c(-0.95, -0.95, 0, 0),
     ybottom = c(1.6, 2.5, 1.6, 2.5),
     xright = c(0, 0, 0.95, 0.95),
     ytop = c(2.5, 3.5, 2.5, 3.5),
     border = c("blue", "green", "red", "yellow"))

usr <- par('usr')

clip(x1 = 0,
     x2 = 0.95,
     y1 = 1.6,
     y2 = 2.5)

points(x = yelich,
       pch = 20)


do.call(what = "clip",
        args = as.list(usr))

Created on 2019-07-02 by the reprex package (v0.3.0)

If you want to do using ggplot2, I suppose one way will be filter the observations first. There may be other options too, but I don't know much about ggplot. Sorry!

That looks great. Thank you!

This topic was automatically closed 7 days after the last reply. New replies are no longer allowed.