A fundamental question here is how to best represent the data, matrix or tidy. Your current format, with individuals in rows and columns, corresponds to a matrix format, and you can use matrix functions for it. To use the tidyverse functions, it's easier if you convert your data to a "tidy" format.
Let's make up some fake data for illustration:
set.seed(123)
# create 5 individuals
x <- matrix(runif(5),
            nrow = 5)

# make a data.frame of distances
dat <- (100 * dist(x)) |>
  as.matrix() |>
  as.data.frame()

dat
#>          1         2        3         4         5
#> 1  0.00000 50.072762 12.13994 59.543988 65.288976
#> 2 50.07276  0.000000 37.93282  9.471227 15.216215
#> 3 12.13994 37.932821  0.00000 47.404048 53.149036
#> 4 59.54399  9.471227 47.40405  0.000000  5.744988
#> 5 65.28898 15.216215 53.14904  5.744988  0.000000
Created on 2025-03-12 with reprex v2.1.0
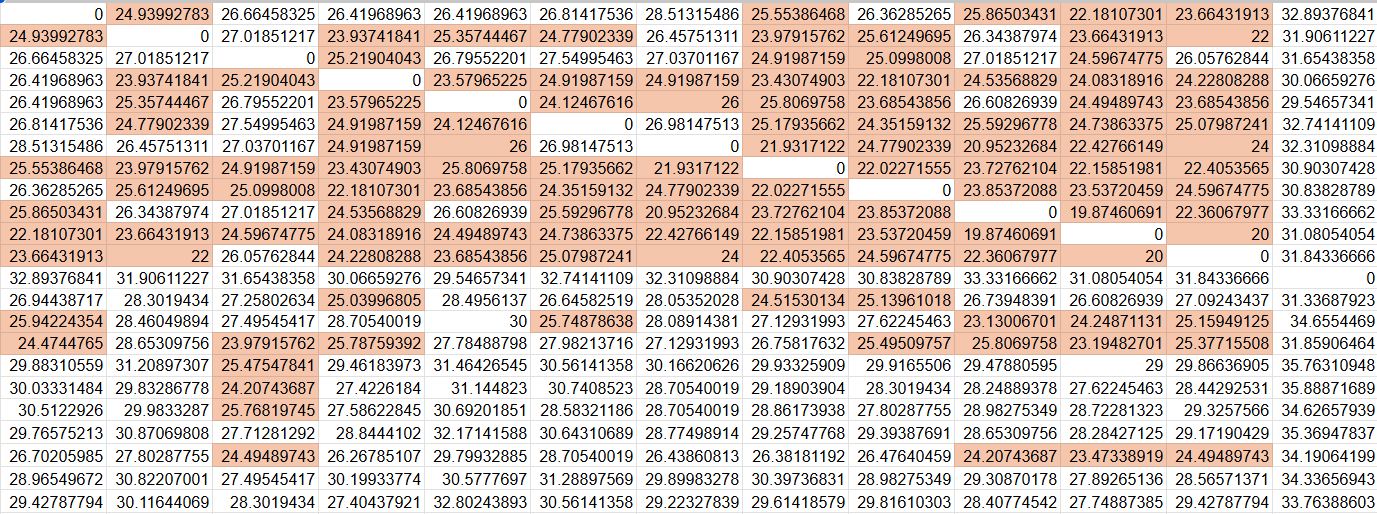
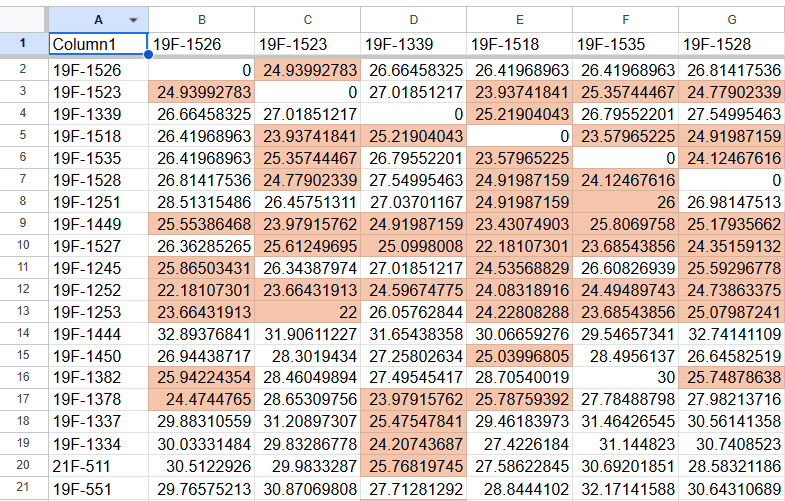
So this dat looks like your starting data frame.
Matrix format
We make this into a matrix:
mat <- as.matrix(dat)
Then we ask, for each column, does it contain a value between a and b (where a and b can be set to 0.1 and 26, here I use a different threshold for illustration).
"for each column" can be done with apply( , 2, ) (the 2 means column here). apply() can apply a function to each column, so we will create our function first:
fails_threshold <- function(x, a, b){
  ! any(x > a & x < b)
}

my_filter <- apply(mat, 2, fails_threshold, a = 0.1, b = 10)
my_filter
#>     1     2     3     4     5
#>  TRUE FALSE  TRUE FALSE FALSE
So out of 5 columns, the 2nd, 4th and 5th contain values between 0.1 and 10.
Finally, we can subset the matrix, keeping only the 2 columns that pass the filter:
mat_subset <- mat[, my_filter]
#>          1        3
#> 1  0.00000 12.13994
#> 2 50.07276 37.93282
#> 3 12.13994  0.00000
#> 4 59.54399 47.40405
#> 5 65.28898 53.14904
Or we can use the same filter on both rows and columns:
mat_subset <- mat[my_filter, my_filter]
mat_subset
#>          1        3
#> 1  0.00000 12.13994
#> 3 12.13994  0.00000
Tidyverse approach
To best use this approach, you need "tidy" data: where each row is an observation, each column a variable. So your current format is "too wide", we first need to make it long:
library(tidyverse)

dat_long <- dat |>
  rownames_to_column("id_1") |>
  pivot_longer(cols = -id_1,
               names_to = "id_2",
               values_to = "distance")
dat_long
#> # A tibble: 25 × 3
#>    id_1  id_2  distance
#>    <chr> <chr>    <dbl>
#>  1 1     1         0
#>  2 1     2        50.1
#>  3 1     3        12.1
#>  4 1     4        59.5
#>  5 1     5        65.3
#>  6 2     1        50.1
#>  7 2     2         0
#>  8 2     3        37.9
#>  9 2     4         9.47
#> 10 2     5        15.2
#> # ℹ 15 more rows
Since dat was symmetric, note that we have duplicates (where id_1 and id_2 are inverted), you could filter for only the cases where id_1 < id_2 for example.
Now, note that filter() is to filter rows, and select() to select columns. In this case we only want to filter rows. And we want to do it by group, so we'll use group_by():
dat_long |>
  group_by(id_1) |>
  filter(! any(distance > .1 & distance < 10))
#> # A tibble: 10 × 3
#> # Groups:   id_1 [2]
#>    id_1  id_2  distance
#>    <chr> <chr>    <dbl>
#>  1 1     1          0
#>  2 1     2         50.1
#>  3 1     3         12.1
#>  4 1     4         59.5
#>  5 1     5         65.3
#>  6 3     1         12.1
#>  7 3     2         37.9
#>  8 3     3          0
#>  9 3     4         47.4
#> 10 3     5         53.1
So just as with the matrix approach, we selected the id_1 with a value of 1 and 3, we do get the same filter.