Filtering a dataframe in a loop and apply a function or applying a function on each element of a dataframe (?)

I am struggling to perform the following task I have a data frame with 5 columns.


> df  
        id     c month  n             s
1    10076 Other     1  1 Other_Breeder
2    10233 Other     1  1 Other_Breeder
3    15590 Other     1  1 Other_Breeder
4    20373 Other     1  1 Other_Breeder
5    21161 Other     1  1 Other_Breeder
6    22057 Other     1  1 Other_Breeder
7    22929 Other     1  1 Other_Breeder

The third column codes for the Month (possible values 1 to 12) of the sample. I have repeated records for each month

For each month, taking the n value I would like to apply the following function

1-(1-s[i]*a[i])^df$n[i]

where s and a are vectors, results of a simulation (10000 iterations) I gave it a try with a for loop

results<-data.frame(m1=numeric(iters))
results<-cbind(results,rep(results[1],11))
colnames(results)<-paste("m", sep = "_", 1:12)


for (j in seq_along(results)) {
  for (i in 1:iters) {
    if (df$month[i]== "1"){results$m_1[i]<-1-(1-s[i]*a[i])^df$n[i]}
    if (df$month[i]== "2"){results$m_2[i]<-1-(1-s[i]*a[i])^df$n[i]}
    ########etc
  } 
}
but it returns 0 values . I also tried to split the dataframe and apply a function over the list

df=split(df,df$month)
results=lapply(df,function(x)1-(1-s*p)^df[[x]]$n)

but I didn't make a go for it.

Could anyone help me to code it properly?

I would like to obtain a vector of length= iters for each month e.g.

m1=df %>% filter (month=="1") 
m1new<-numeric(iters) 
for (i in 1:iters) { m1new[i]<- 1 - (1 - s[i] * a[i])^m1$n[i]} 

this should be repeated for each month and the output should be stored in a list (12 elements) or dataframe with 12 columns

Thanks !!!

Welcome to R @angela_italy !
Firstly a for loop running across rows of a data.frame is a very bad idea - it is not only a 100X slower but is difficult to read & debug.
Instead we use the vector power or R.

It will be easier for us to suggest if you can provide a desired output data too.

Hi Samjmeh,
I do not have a preferred output,
I think that either a data.frame or a list containing the 12 vectors are fine

Sorry if I was not clear. The sample output is necessary to see the actual data you expect. Explaining in words is not always clear.

or a list containing 12 elements . Each one containing a vector of length equal to iters ( 10000)

I hope it is clearer now

It is unfortunately not clear yet, to me.
If you would like someone to help, make the representative example clearer.
If you haven't read what a reprex looks like, please go throuth this excellent explanation and use the reprex package to explain your code.

rm(list = ls())

setwd(dirname(rstudioapi::getActiveDocumentContext()$path))
#> Error: RStudio not running
getwd()
#> [1] "C:/Users/Angela/AppData/Local/Temp/RtmpUZ4zh3/reprex-26305ae4190-awful-dog"

#load required packages 
library(mc2d)
#> Loading required package: mvtnorm
#> 
#> Attaching package: 'mc2d'
#> The following objects are masked from 'package:base':
#> 
#>     pmax, pmin
library(gplots)
#> 
#> Attaching package: 'gplots'
#> The following object is masked from 'package:stats':
#> 
#>     lowess
library(RColorBrewer)
library(dplyr)
#> 
#> Attaching package: 'dplyr'
#> The following objects are masked from 'package:stats':
#> 
#>     filter, lag
#> The following objects are masked from 'package:base':
#> 
#>     intersect, setdiff, setequal, union
library(tidyverse)
set.seed(99)
iters<-1000

#inputs 
p<- 0.0005 
p2<- 0.05 
se<-rbeta(iters,96,6)
df<-read.csv2("df.csv")
#> Warning in file(file, "rt"): cannot open file 'df.csv': No such file or
#> directory
#> Error in file(file, "rt"): cannot open the connection
df$X<-NULL
#> Error in df$X <- NULL: object of type 'closure' is not subsettable
prp.sj<-0.1  
prp.other<- 1-prp.sj 
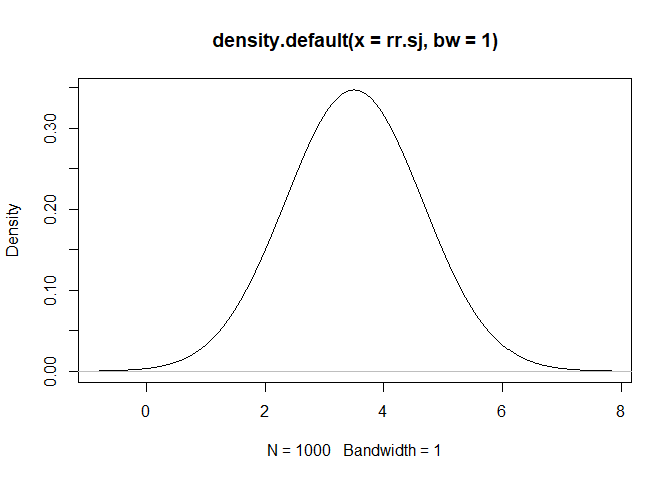
rr.sj<- rpert(iters, min = 2, mode = 3.5, max = 5) 
plot(density(rr.sj, bw=1))

ar.other<-numeric(iters) #preallocate the results  
ar.sj<-numeric(iters) #preallocate the results 
for (i in 1:iters) {
  ar.other[i]<-1/(prp.other+rr.sj[i]* prp.sj)
  ar.sj[i]<-ar.other[i]*rr.sj[i]
}


prp.b<- 0.55
prp.s<- 1-prp.b
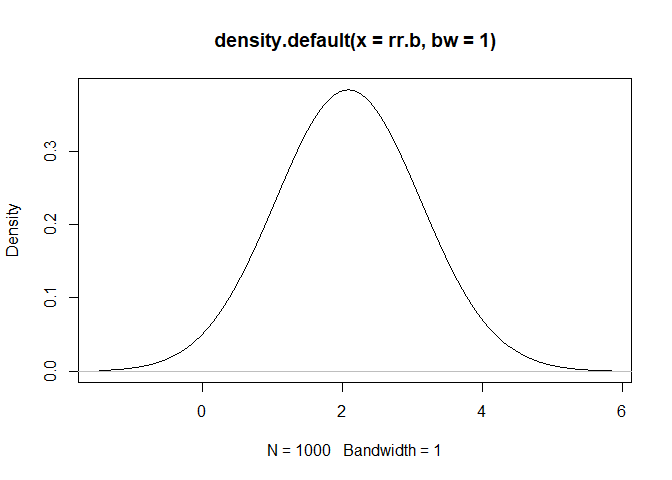
rr.b<-rpert(iters,min=1.5, mode=2, max=3)
plot(density(rr.b, bw=1))

ar.s<-numeric(iters) #preallocate the results 
ar.b<-numeric(iters)#preallocate the results 
for(i in 1:iters){
  ar.s[i]<-1/(prp.s+rr.b[i]*prp.b)
  ar.b[i]<-ar.s[i]*rr.b[i]
}


epi.h<-data.frame(other.s=numeric(iters),other.b=numeric(iters),sj.s=numeric(iters),sj.b=numeric(iters)) #preallocate dataframe

for (i in 1:iters) {
  epi.h$other.s[i]<-p2*ar.other[i]*ar.s[i]
  epi.h$other.b[i]<-p2*ar.other[i]*ar.b[i]
  epi.h$sj.s[i]<-p2*ar.sj[i]*ar.s[i]
  epi.h$sj.b[i]<-p2*ar.sj[i]*ar.b[i]
}


prp.ad<-0.2
prp.g<-1-prp.ad
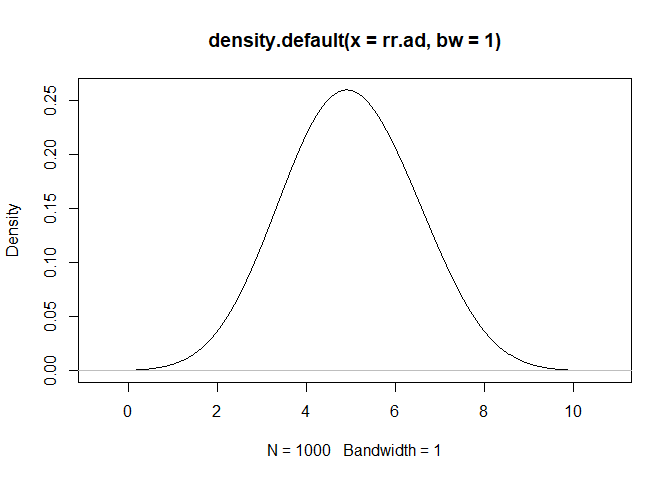
rr.ad<-rpert(iters,min=2,mode=5,max=8)
plot(density(rr.ad, bw=1))

ar.g<-numeric(iters) #preallocate the results 
ar.ad<-numeric(iters)#preallocate the results  
for(i in 1:iters){
  ar.g[i]<-1/(prp.g+rr.ad[i]*prp.ad)
  ar.ad[i]<-ar.g[i]* rr.ad[i]
}


epi.a<- data.frame(g=numeric(iters),a=numeric(iters)) #preallocate the results 
for (i in 1:iters) {
  epi.a$g[i]<-p*ar.g[i]
  epi.a$a[i]<-p*ar.ad[i]
}


############Here the problem 

#the idea is to do this operation for each month month of df$column month 


m1=df %>% filter (month=="1") 
#> Error in UseMethod("filter"): no applicable method for 'filter' applied to an object of class "function"
m1new<-numeric(iters) 
for (i in 1:iters) { m1new[i]<- 1 - (1 - se[i] * epi.a$a[i])^m1$n[i]} 
#> Error in eval(expr, envir, enclos): object 'm1' not found


##my try 

results<-data.frame(m1=numeric(iters))
results<-cbind(results,rep(results[1],11))
colnames(results)<-paste("m", sep = "_", 1:12)


for (j in 1:12) {
  for (i in 1:iters) {
    if (df$month[i]== "1")results$m_1[i]<- 1 - (1 - se[i] * epi.a$a[i])^m1$n[i]
    else if (df$month[i]== "2")results$m_2[i]<- 1 - (1 - se[i] * epi.a$a[i])^m1$n[i]
    else if(df$month[i]== "3")results$m_3[i]<- 1 - (1 - se[i] * epi.a$a[i])^m1$n[i]
    else if(df$month[i]== "4")results$m_4[i]<- 1 - (1 - se[i] * epi.a$a[i])^m1$n[i]
    else if(df$month[i]== "5")results$m_5[i]<- 1 -(1 - se[i] * epi.a$a[i])^m1$n[i]
    else if(df$month[i]== "6")results$m_6[i]<- 1 - (1 - se[i] * epi.a$a[i])^m1$n[i]
    else if(df$month[i]== "7")results$m_7[i]<- 1 - (1 - se[i] * epi.a$a[i])^m1$n[i]
    else if(df$month[i]== "8")results$m_8[i]<- 1 - (1 - se[i] * epi.a$a[i])^m1$n[i]
    else if(df$month[i]== "9")results$m_9[i]<- 1 - (1 - se[i] * epi.a$a[i])^m1$n[i]
    else if(df$month[i]== "10")results$m_10[i]<- 1 - (1 - se[i] * epi.a$a[i])^m1$n[i]
    else if(df$month[i]== "11")results$m_11[i]<- 1 - (1 - se[i] * epi.a$a[i])^m1$n[i]
    else if(df$month[i]== "12")results$m_12[i]<- 1 - (1 - se[i] * epi.a$a[i])^m1$n[i]
  }
  
}
#> Error: object of type 'closure' is not subsettable


#oddly only the first column is filled.

Created on 2022-05-03 by the reprex package (v2.0.1)

Hi .. I have posted the reprex version .. I hope that it is now easy for you to understand it

You have crossed one hurdle! The reprex package worked well for you.

Now to some basics.
The above line will fail to load in any one else's system, isn't it? Hence it is always recommended to remove any reference to your local files, so that the code does not fail.
To give us the data at the beginning paste the output of dput(head(df)) or whatever minimum rows of data is essential to show the problem.

Try again.

Note: Your elaborate code may not be needed, as you are using for loop for iterating on the rows of a data.frame which is quite definitely a bad idea. Try to give us the desired output in dput format.

This is my dataframe (the column month contains the sampling month whereas n contains the number of samples min1 max 902)

dput(head(df))
structure(list(id = c("10076", "10233", "15590", "20373", "21161",
"22057"), c = c("Other", "Other", "Other", "Other", "Other",
"Other"), month = c(1L, 1L, 1L, 1L, 1L, 1L), n = c(1L, 1L, 1L,
1L, 1L, 1L)), row.names = c(NA, 6L), class = "data.frame")

head(df)
id c month n
1 10076 Other 1 1
2 10233 Other 1 1
3 15590 Other 1 1
4 20373 Other 1 1
5 21161 Other 1 1
6 22057 Other 1 1

Please can you provide the results also in dput() format.
I would suggest creating a minimum working example, as I suspect your head(results) may not be map to head(df)as the rows are all zeros.

Hi Sanjemh
Here the results structure
As far as I am concerned the output could also be a list ...
My aim is to perform this task over the 12 months
I do not care if the results are stored in a dataframe or in a list with 12 objects
Could you please help me find an alternative way in case?

str(results)
'data.frame': 1000 obs. of 12 variables:
m_1 : num 0.001429 0.000973 0.001496 0.001261 0.001465 ... m_2 : num 0 0 0 0 0 0 0 0 0 0 ...
m_3 : num 0 0 0 0 0 0 0 0 0 0 ... m_4 : num 0 0 0 0 0 0 0 0 0 0 ...
m_5 : num 0 0 0 0 0 0 0 0 0 0 ... m_6 : num 0 0 0 0 0 0 0 0 0 0 ...
m_7 : num 0 0 0 0 0 0 0 0 0 0 ... m_8 : num 0 0 0 0 0 0 0 0 0 0 ...
m_9 : num 0 0 0 0 0 0 0 0 0 0 ... m_10: num 0 0 0 0 0 0 0 0 0 0 ...
m_11: num 0 0 0 0 0 0 0 0 0 0 ... m_12: num 0 0 0 0 0 0 0 0 0 0 ...

This is still not in dput(). Please donot do a str(). Only dput(results). And I am sorry without the desired output mapping to the input it will be very difficult to decode for me. I am not sure you understand mapping input to the desired output. You are just sending the structure of the whole data. I need the real output for the input. In case this is not coming, I am sorry, you have to wait for other people to help you.

[This post has been redacted by a moderator]

[This post has been redacted by a moderator]

[This post has been redacted by a moderator]

I have attached it,
but I had to cut it into three posts as there's a body text limit on the forum
Thanks a lot for your time

I'm afraid to say that this thread of the forum, seems to have become somewhat muddled and gone off the rails.
Can I encourage you to go back to basics, read the reprex guide, think about what it means to have a minimal example of an issue you like support with.
Of course providing data is important, but providing too much data is almost as problematic as providing too little.

I will proceed by giving you a hint of a way forward, though it will necessarily be abstract, as it is simply too much effort to take on your particulars given the lack of curation of your issue to date.

That said if I had a data.frame containing parameters over which I wanted to apply a function this general approach is favourable:

library(tidyverse)


(somedata <- expand.grid(month=1:12,
                        n=1:2))

function_that_uses_parameters <- function(months_,n_){
  months_^2*100+n_
}

somedata %>% mutate(
       results_of_func = function_that_uses_parameters(months_ = month,
                                                       n_ = n))

Thanks @nirgrahamuk and I agree the thread has gone off rails. The last post was an embarrassment to me as it completely washed off my patient attempt to hand hold someone who is new here.

If your above attempt also fails, I wanted to give @angela_italy a last chance with the following two clear objectives.

1. Can you reduce your input to less than 10 or 15 rows and 5-6 columns? Even if you have 12 months and 20 categories you may just take 2 or 3 months and 3-4 categories in the example dataframe.

2. Can you hand create your desired output for the above input data.frame? And yes you can type it out too

If you donot understand what I am asking, or what nirgrahamuk is suggesting please read the reprex documentation again in full and come back again.

And please can you delete your large posts of thousands of data elements.