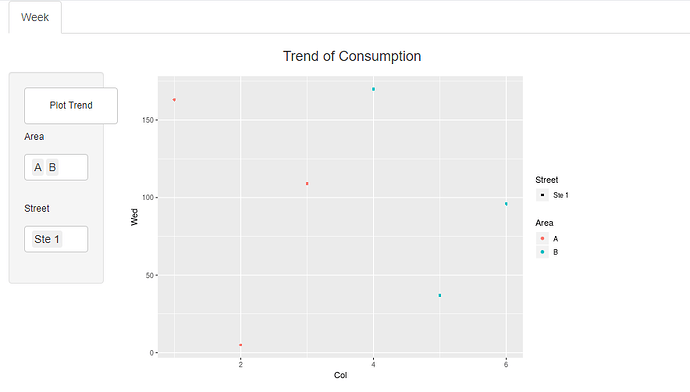
I have plotted in r shiny for multiple variables. I have also applied a filtering for that as per below code but I am getting an error. Once I click on Area and Street filter the ggplot should change accordingly.
library(shiny)
library(ggplot2)

ui <- fluidPage(
  tabsetPanel(tabPanel("Week",titlePanel(h4("Trend of Consumption",align="center")),
                       sidebarLayout(
                         sidebarPanel(
                           selectInput("trend",h6("trend"),choices = c("","Plot"),width = 120),br(),
                           selectInput("area",h6("Area"),choices = c("",levels(df$Area)),width =
                                         150,multiple = TRUE),
                           selectInput("street",h6("Street"),choices =
                                         c("",levels(df$Street)),width =
                                         150,multiple = TRUE),width = 2,height = 1000),
                         mainPanel(plotOutput("graph"))
                       )
  ))
)

server <- function(input, output, session) {
  selectedData <- reactive({
    df[df %in% input$trend | df$Area %in% input$area | df$Street %in% input$street, ]

  })
  #graph <- eventReactive(
  #  input$trend,{
  graph <- reactive({
    ggplot(data = selectedData(), aes(Col, Wed, col = Area, shape = Street))+
      geom_point()
    # geom_line(aes(y=Mon, colour = "Mon"))+
    # geom_line(aes(y=Tue, colour = "Tue"))+
    # geom_line(aes(y=Wed, colour = "Wed"))+
    # ylab("hj")
  }
  )
  output$graph <- renderPlot(
    {
      graph()
    }
  )
}

shinyApp(ui, server)