I am having an issue where adding the fill aes breaks my position in geom_pointrange.
I run this code:
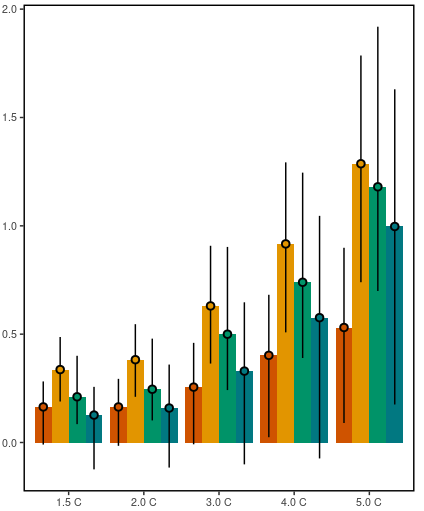
  region_bar_plot = ggplot(plot_data, aes(x = gwl_bin, y = avg_impact, fill = region_level)) +
    geom_col(position = position_dodge(width = .9)) +
    geom_pointrange(aes(ymin = y_eb_min, ymax = y_eb_max), position = position_dodge(width = .9), color = "black", shape = 21) +
    scale_fill_manual(values = unique(plot_data$color),
                      labels = legend_val)
and it returns this plot:
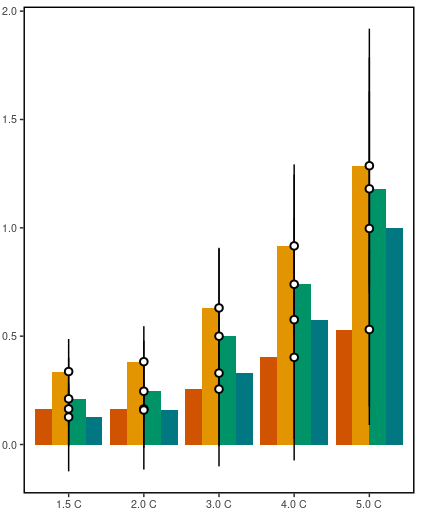
But I want the center of the circles to be white not blank so add fill = 'white'
making my code:
  region_bar_plot = ggplot(plot_data, aes(x = gwl_bin, y = avg_impact, fill = region_level)) +
    geom_col(position = position_dodge(width = .9)) +
    geom_pointrange(aes(ymin = y_eb_min, ymax = y_eb_max), position = position_dodge(width = .9), color = "black", shape = 21, fill = 'white') +
    scale_fill_manual(values = unique(plot_data$color),
                      labels = legend_val)
But now error bars are no longer dodge correctly and overlap rather than sitting on their respective columns:
Has any one run into this issue before? What can I do to solve it?