In my application I have a feature where user is allowed to upload a file. This feature works fine on IE. Whereas in chrome and firefox, the file uploads takes a long time.
On uploading a progress bar appears which shows the upload status, for IE this is swift . Whereas for chrome, the upload remains at 0% for a couple of minutes after which it starts.
File size is not an issue here as this is persistent across file sizes of different range from kbs to mbs.
Hi @kvothe, thanks for writing in. Without more detailed information (e.g., the file of interest and a minimal reproducible example), it will be very difficult for us to identify the problem.
Hej everyone,
My apps are deployed on shinyapps.io.
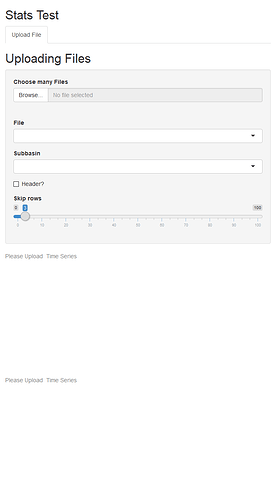
The upload works just fine in IE, but in Opera & Firefox there is exactly the same issue that @kvothe described. Here´s a repex of a test app.
library(shiny)
library(dygraphs)

ui <- fluidPage(
  titlePanel("Stats Test"),
  tabsetPanel(
    tabPanel("Upload File",
             titlePanel("Uploading Files"),sidebarLayout(
               sidebarPanel(
                 fileInput('mfiles', 'Choose many Files',
                           accept=c('text/csv',
                                    'text/comma-separated-values,text/plain',
                                    '.csv', ".s*", ".l*", ".m*", '*,*'),
                           multiple = TRUE),
                 selectInput('sub', 'File', ""),
                 selectInput('col', 'Subbasin', ""),
               checkboxInput('header', label = 'Header?', value = 0),
               sliderInput('skip', label = 'Skip rows', value = 3, min = 0, max = 100)),
               mainPanel(fluidRow(column(12, dygraphOutput(outputId = "dymany", height = "300px")),
                                  column(12, dygraphOutput(outputId = "dyselected", height = "300px"))

    ))))))

server <- function(input, output, session) {

  indat<-reactive({
    v <- lapply(input$mfiles$datapath,function(mf){
      try(fread(mf, skip = input$skip, header = input$header))
    })
    names(v)<-input$mfiles$name
    updateSelectInput(session, inputId = 'sub', label = 'File',
                      choices = names(v), selected = names(v)[NCOL(v)])
    return(v)
  })

  sel<-reactive({
    req(indat())
    #sel<-reactiveValues(input$col)

    sel<-indat()[input$sub] %>% as.data.frame(., stringsAsFactors = F)
    names(sel)<-(c((rep_len(1:NCOL(sel), length.out = NCOL(sel)-1)
                    %>% as.character), 'avr.'))

    updateSelectInput(session, inputId = 'col', label = 'Subbasin',
                      choices = names(sel), selected = names(sel[NCOL(sel)]))

    return(sel)
  })

  output$sel.table <-renderTable(
    sel() [, input$col]
  )


  output$dymany<-renderDygraph({
    req(indat())
    validate(
      need(input$mfiles$datapath != "", "Please Upload  Time Series"))
    indat() %>% data.frame() %>% dygraph(., main = 'Output of multiple Files') %>%
      dySeries(colnames(.)) %>% dyLegend(width = 400) %>%
      dyOptions(stackedGraph = F, fillGraph = F, fillAlpha = 0.4, logscale = T) %>%
      dyRangeSelector(height = 40) %>%
      dyHighlight(highlightCircleSize = 5,
                  highlightSeriesBackgroundAlpha = 0.3,
                  hideOnMouseOut = F) %>% dyUnzoom()    -> d1
    d1$x$css = "
    .dygraph-title {color: navy;    font-weight: bold;  }
    .dygraph-legend > span {display:none;}
    .dygraph-legend > span.highlight { display: inline; }
    "
    d1})

  output$dyselected<-renderDygraph({
    req(indat())
    validate(
      need(input$mfiles$datapath != "", "Please Upload  Time Series"))

    sel() %>% as.data.frame() %>% dplyr::select(input$col) %>%
      dygraph(., main = paste0('Output of ', input$sub)) %>%
      dySeries(name = input$col, color = "red", label=paste0('Basin ', input$col)) %>%
      dyLegend(width = 400) %>%
      dyOptions(stackedGraph = F, fillGraph = T, fillAlpha = 0.4, logscale = F) %>%
      dyRangeSelector(height = 40) %>%
      dyHighlight(highlightCircleSize = 5,
                  highlightSeriesBackgroundAlpha = 0.3,
                  hideOnMouseOut = F) %>%
      dyUnzoom()    -> d2
    d2$x$css = "
    .dygraph-title {color: navy;    font-weight: bold;  }
    .dygraph-legend > span {display:none;}
    .dygraph-legend > span.highlight { display: inline; }
    "
    d2})

}

# Run the application
shinyApp(ui = ui, server = server)
#>
#> Listening on http://127.0.0.1:5326
Created on 2019-07-23 by the reprex package (v0.3.0)
Here is another simple example from https://shiny.rstudio.com/reference/shiny/latest/fileInput.html
Only run examples in interactive R sessions
if (interactive()) {
ui <- fluidPage(
sidebarLayout(
sidebarPanel(
fileInput("file1", "Choose CSV File",
accept = c(
"text/csv",
"text/comma-separated-values,text/plain",
".csv")
),
tags$hr(),
checkboxInput("header", "Header", TRUE)
),
mainPanel(
tableOutput("contents")
)
)
)
server <- function(input, output) {
output$contents <- renderTable({
# input$file1 will be NULL initially. After the user selects
# and uploads a file, it will be a data frame with 'name',
# 'size', 'type', and 'datapath' columns. The 'datapath'
# column will contain the local filenames where the data can
# be found.
inFile <- input$file1
if (is.null(inFile))
  return(NULL)

read.csv(inFile$datapath, header = input$header)
})
}
shinyApp(ui, server)
}
