Sometimes I have graphs where I have a lot of facets and the figure becomes illegable with the default output, so I change fig.height and fig.width within the chunk settings like so:
```{r fig.height = 20, fig.width = 3}
library(ggplot2)
ggplot(mtcars, aes(x = mpg, y = cyl)) +
  geom_point()
```
but then unfortunately the output looks like this:
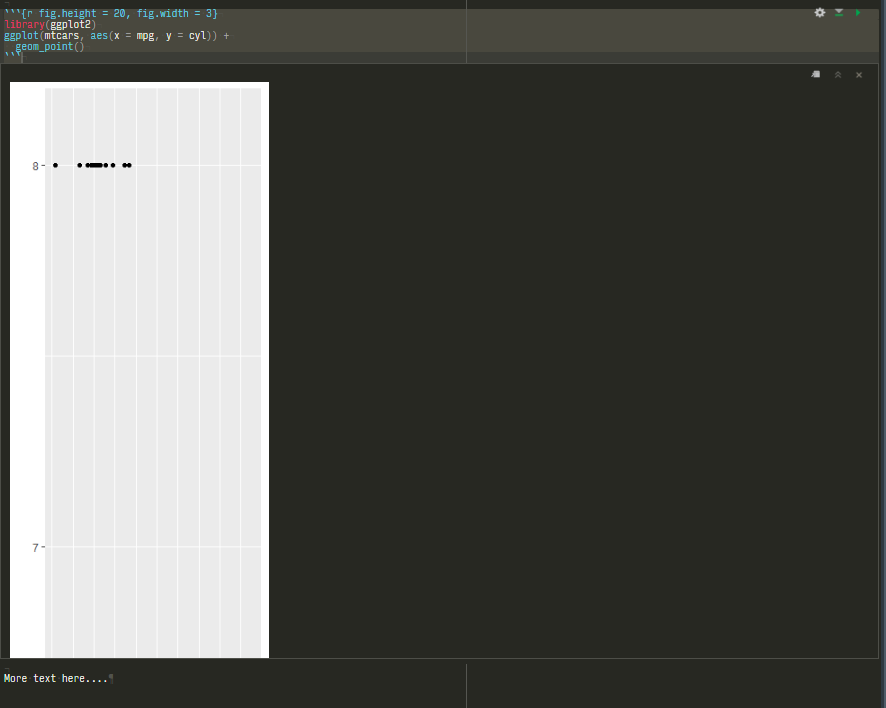
Edit: sorry, I should be clearer: In this example, I can't see the y-axis values below ~7 or the x-axis within the Rmarkdown document. I can click the little icon to show in new window, and it's fine, but I'd prefer to not have to do that every time.
FWIW, I'm on Windows 10, RStudio 1.2.1114