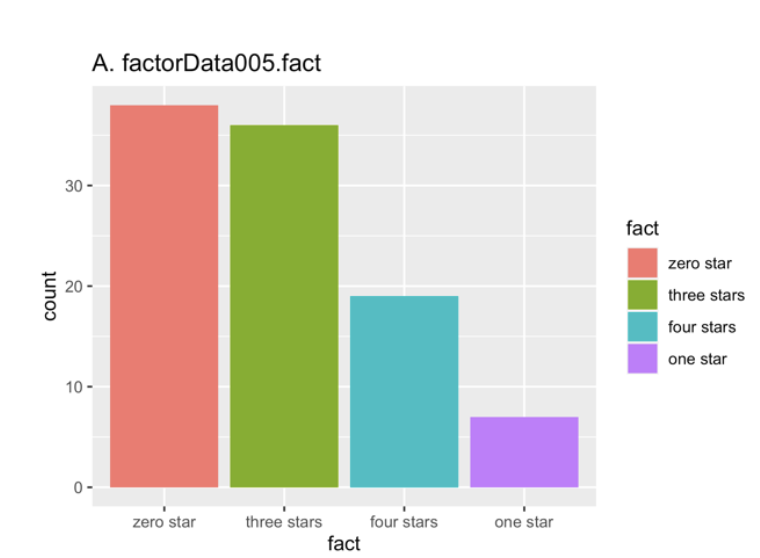
Given a data set "factorData005.fact", how to get this graph?
[1] one star three stars zero star four stars three stars three stars zero star
[8] four stars one star zero star three stars four stars three stars zero star
[15] three stars three stars one star one star three stars four stars four stars
[22] zero star three stars four stars four stars zero star one star zero star
[29] zero star three stars zero star three stars zero star zero star zero star
[36] three stars three stars zero star three stars zero star zero star zero star
[43] zero star four stars zero star three stars four stars zero star three stars
[50] zero star four stars zero star three stars four stars three stars three stars
[57] zero star three stars zero star four stars three stars one star four stars
[64] three stars zero star four stars zero star zero star zero star zero star
[71] three stars three stars three stars four stars zero star four stars zero star
[78] three stars four stars zero star zero star zero star three stars three stars
[85] three stars three stars zero star three stars four stars three stars one star
[92] three stars three stars zero star four stars three stars zero star zero star
[99] three stars zero star
Levels: zero star three stars four stars one star
factorData005.fact <- factor(factorData005.fact, levels = c("zero star", "three stars", "four stars", "one star"))
df <- data.frame(value = factorData005.fact)
p3 <- ggplot(df, aes(x=value)) + geom_bar(fill=c("red", "green", "cyan", "purple")) + scale_shape_manual(labels=c("zero star", "three stars", "four stars", "one star"))
print(p3)
Above is my code. The labels are not added successfully.
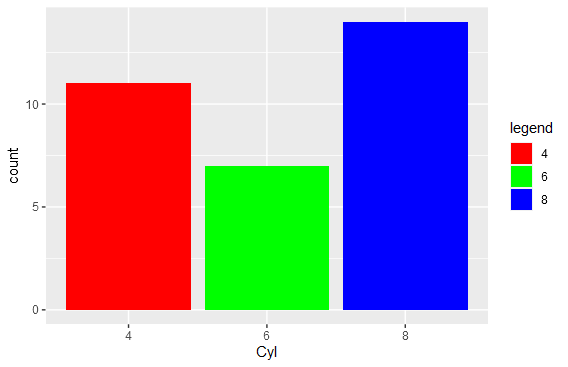
you dont have a shape aesthetic , so there is nothing to attach the labels to.
I would expect that you should add fill=value as an aesthetic along with x=value, so that fill colours will come from the value (the star text levels, then you could have a scale_fill_manual, where you set the colours against the star text, i.e. red for zero star etc.
Heres an example using built in mtcars data.
 ggplot(mtcars, aes(x=as.factor(cyl), fill=as.factor(cyl) )) +
 geom_bar( ) +
scale_fill_manual(values = c("4"="red", "6"="green", "8"="blue") ,
name="legend" ) +
 xlab("Cyl")
Hi @Trevor1 , remember put a reproducible example of data.
And easy way is paste the result of this:
dput(head(factorData005,2)) # if the data frame is `factorData005`
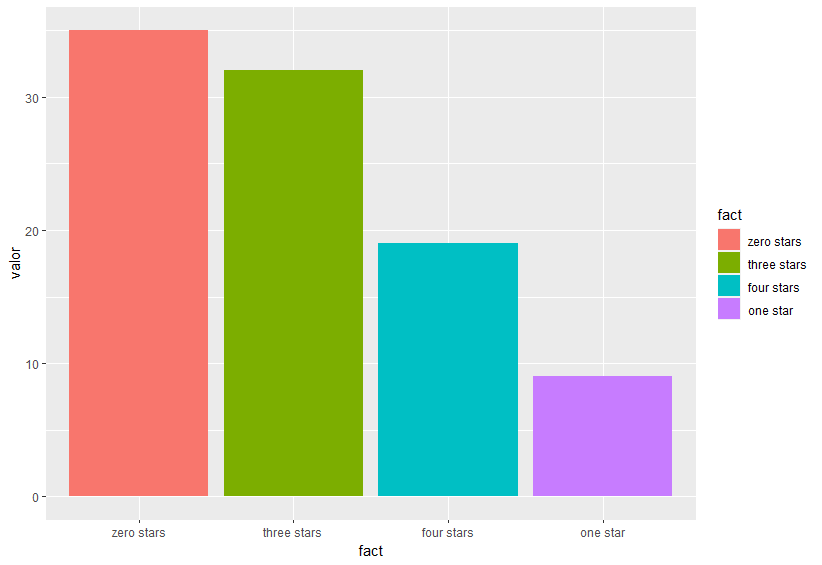
df <- data.frame(fact=c('zero stars','three stars','four stars','one star'),
                 valor=c(35,32,19,9))

df$fact<- factor(df$fact, levels = c('zero stars','three stars','four stars','one star'))

ggplot(df, aes(x=fact,y=valor, fill=fact)) +
  geom_col() +
  labs(title = 'Put title')
Some questions:
- Why you data dont have a
two stars? - What labels you want to add?
This topic was automatically closed 42 days after the last reply. New replies are no longer allowed.
If you have a query related to it or one of the replies, start a new topic and refer back with a link.