I am trying to facet my graph in a particular way but have been unable to solve it. This is a example dataset.
data1 <- read.table ("fruit.txt",header=TRUE, check.names=FALSE, sep = "\t")
head(data1)
| Fruit | Group | LDA | Status | test |
|---|---|---|---|---|
| Apple | Positive 1 | 3.528347269 | Positive | A |
| Banana | Negative 1 | -3.498628146 | Negative | A |
| Orange | Positive 1 | 3.409607861 | Positive | A |
| Pear | Positive 1 | 3.299269006 | Positive | B |
| Kiwi | Positive 1 | 3.027402165 | Positive | B |
| Grape | Positive 1 | 3.012986706 | Positive | B |
| Apple | Positive 1 | 2.55455132 | Positive | B |
| Banana | Positive 1 | 2.539428451 | Positive | B |
| Melon | Positive 1 | 2.297060504 | Positive | B |
| Peach | Positive 1 | 2.156143944 | Positive | B |
| Plum | Positive 1 | 2.02726917 | Positive | B |
| Strawberry | Negative 2 | -0.449496472 | Negative | C |
| Apple | Negative 2 | -0.44951615 | Negative | C |
| Banana | Negative 2 | -2.568749436 | Negative | C |
| Peach | Positive 2 | 2.803563813 | Positive | C |
| Pineapple | Positive 2 | 3.706876809 | Positive | C |
library(ggplot2)
library(scales)
library(ggplot2)
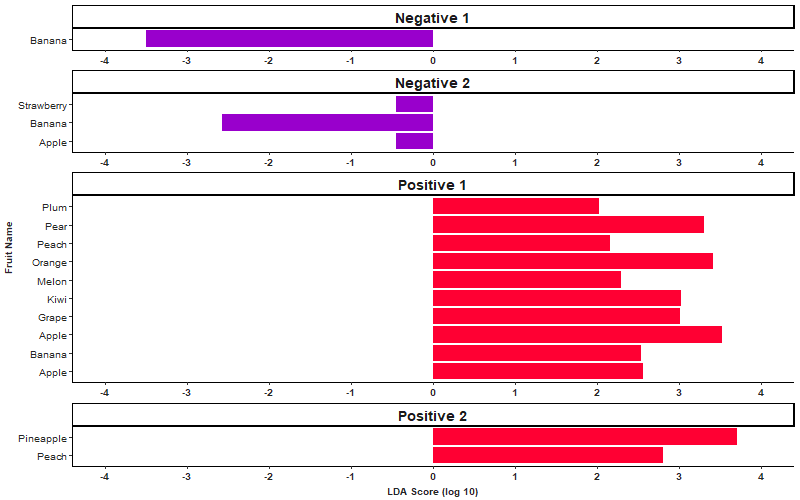
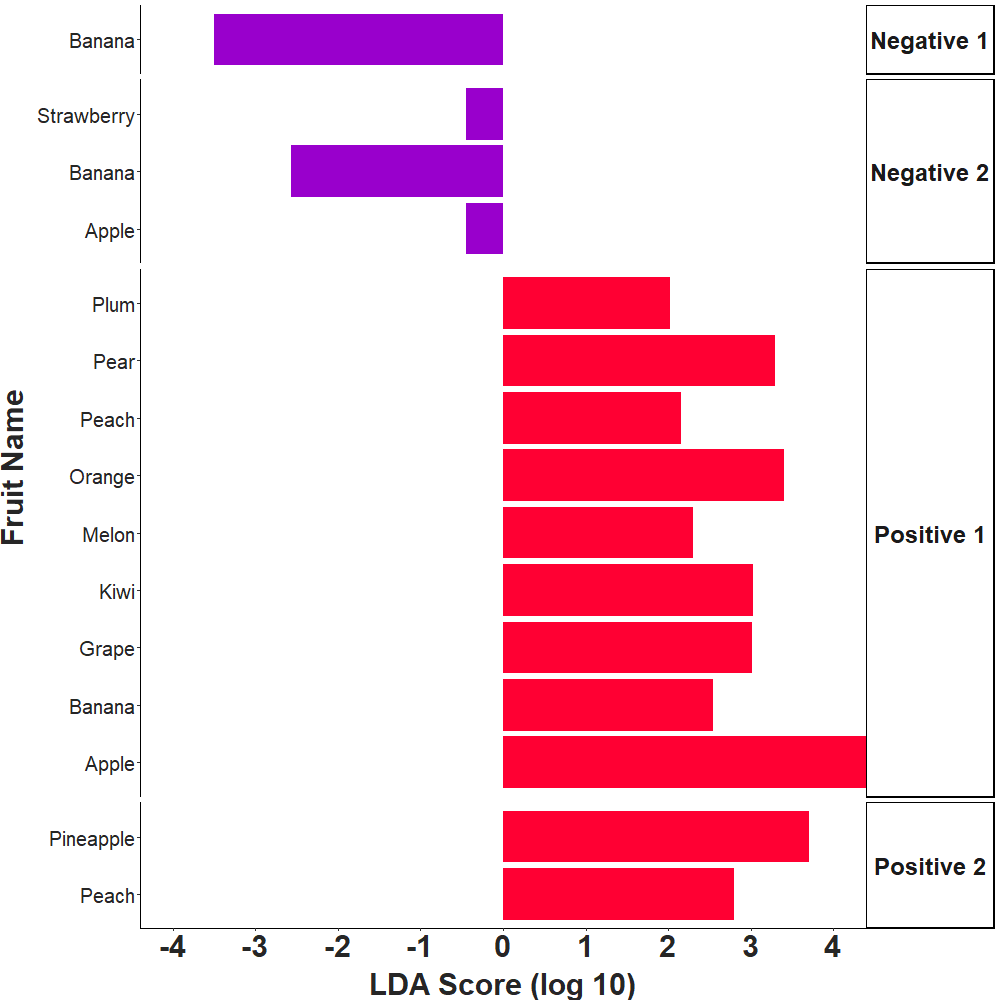
plot1a <- ggplot(data1, aes(Fruit,LDA, fill=Status))  + theme_classic()+ labs(y="LDA Score (log 10)",x="Fruit Name") + coord_flip(ylim=(c(-4,4)))  + geom_bar(stat = "identity")+ scale_fill_manual(values = c("#9900CC","#FF0033"), name= "Growth")+ theme (legend.position ='none',axis.text.x = element_text( hjust = 0.5, vjust = 1,face="bold",size =30, colour ='gray15'), axis.text.y = element_text(face = "plain",size = 20 , colour = "gray15"),legend.text=element_text(size=14 ), axis.title.y = element_text(face ="bold", size = 30, vjust = 2.0, colour = "gray15"),axis.title.x = element_text(face ="bold", size = 30, vjust = 0.005, colour = "gray15"),legend.title = element_text(size =18, colour = "gray15"),strip.text = element_text(size = 24, face = "bold"))+ scale_y_continuous(breaks = c(-4,-3,-2,-1,0,1,2,3,4))+facet_grid(vars(Group), scales = "free",space = "free")+ theme(strip.text.y = element_text(angle = 0))

plot1a
png("fruit.png", width = 1000, height = 1000)
plot1a
dev.off()
plot1b <- ggplot(data1, aes(Fruit,LDA, fill=Status))+ theme_classic()+ labs(y="LDA Score (log 10)",x="Fruit Name") + coord_flip(ylim=(c(-4,4)))  + geom_bar(stat = "identity")+ scale_fill_manual(values = c("#9900CC","#FF0033"), name= "Growth")+ theme (legend.position ='none',axis.text.x = element_text( hjust = 0.5, vjust = 1,face="bold",size =30, colour ='gray15'),axis.text.y = element_text(face = "plain",size = 20 , colour = "gray15"),legend.text=element_text(size=14 ),axis.title.y = element_text(face ="bold", size = 30, vjust = 2.0, colour = "gray15"), axis.title.x = element_text(face ="bold", size = 30, vjust = 0.005, colour = "gray15"),legend.title = element_text(size =18, colour = "gray15"),strip.text = element_text(size = 24, face = "bold")) + scale_y_continuous(breaks = c(-4,-3,-2,-1,0,1,2,3,4))+facet_wrap(~Group, ncol = 1, scales = "free",drop = TRUE)
plot1b

png("fruit2.png", width = 1000, height = 1000)
plot1b
dev.off()
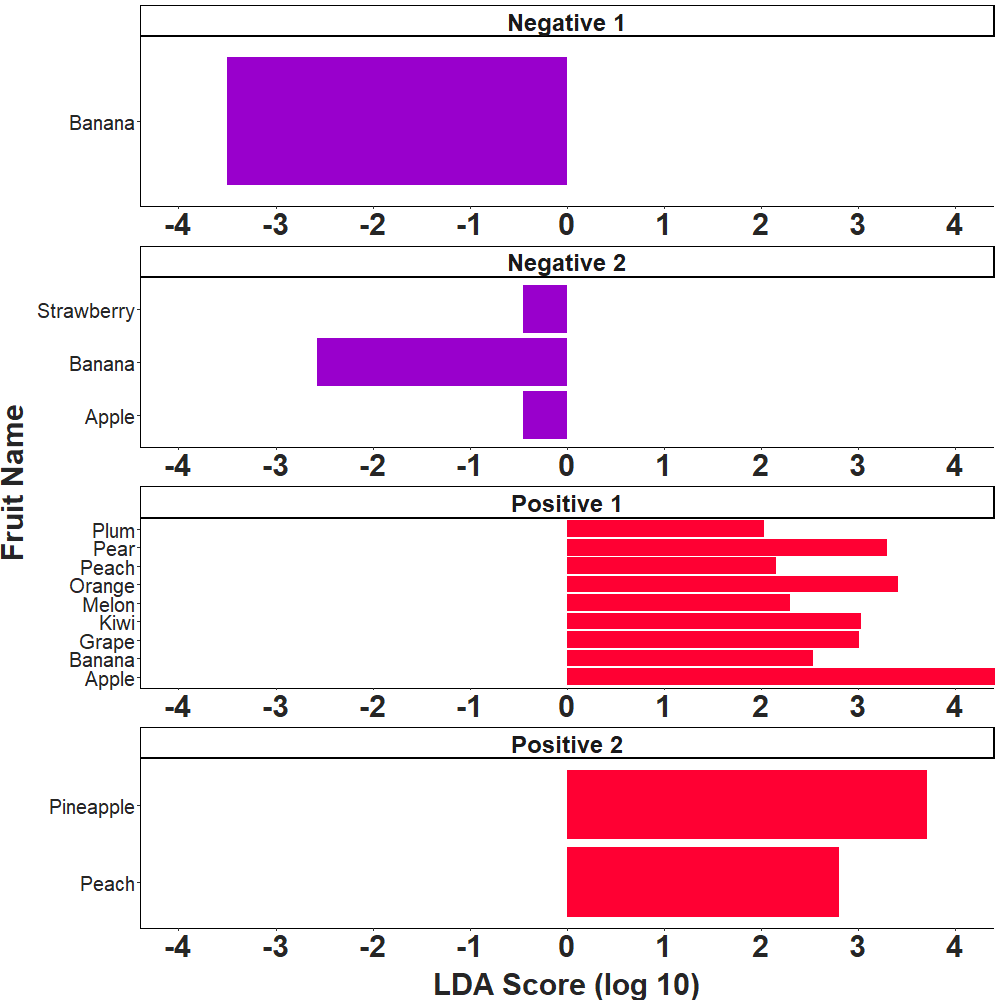
I am looking to create a facet wrap with the facets headed above as in plot1b but with all the fruit widths the same width / height as in plot1a. My facet labels in real life are long and so this would be the nicest way to present them.
Does anyone know how to do this or if it is possible?
Thanks!