I am trying to create a set of histograms where the column colors within the histogram alternate. I have the histogram displaying 50 bins for users to be able to do some simple diagnostics of their results. I am just trying to increase the contrast between the adjacent columns. Additionally, the data could have groupings so sometimes we need facet_wrap sometimes we don't.
I can get the column colors to alternate colors by manually setting the fill. But, when I facet_wrap the plot object the colors don't expand out to the facets and I get Error: Aesthetics must be either length 1 or the same as the data (X): fill). Is there a way to expand the alternating colors to the faceted plots?
Simplified reprex that has groups and faceted data:
library(tidyverse)
data = tibble(
data = rep(1:4,3),
groups = c(rep("A",4),rep("B",4),rep("C",4))
)
p = ggplot(data) +
geom_histogram(aes(x = data),
bins = 4,
color = "black",
fill = rep(c("#e69f00","#009ee9"),2))
#Histogram of everything
p
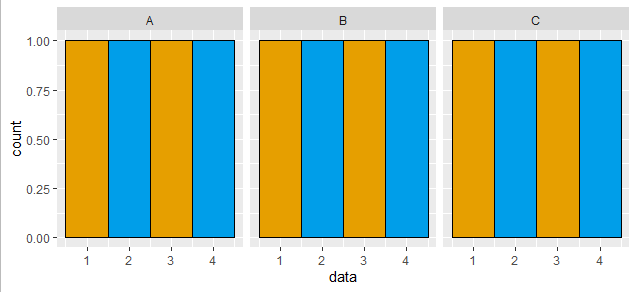
p = p + facet_wrap(vars(groups))
#Faceted histogram
p