Fable forecast - est

Hello all,
I tried to initate a forecast in working with tsibbles and the fable package. My forecast result is sadly not very good, and I wanted to make sure that the reason for that is the problem with my stats and the data and not my R code. In hilo i see that the outpur is the same for every row of the value which makes me think that the model might be not working.

Data source: Ethereum Price | ETH Price Index and Live Chart — CoinDesk 20

library(feasts) # working with tsibbles
library(tsibble)
library(fable) #for tsibble flow eps and so on

library(tidyverse)
#library(dplyr) included tidyverse
#library(ggplot2) included tidyverse

library(lubridate) #date transformation package

library(magrittr) # advanced pipeing

library(sweep) #helps in working with ets objects for vizulasiation and transformation brings ts in tidyworkflow

csv_data_1 <- read.csv("ETH_USD_CoinDesk.csv")

z_eth <- mutate(csv_data_1, Currency = NULL, X24h.High..USD. = NULL, X24h.Low..USD.=NULL, X24h.Open..USD.=NULL) %>%
mutate(Date = yearmonth(Date)) %>% group_by(Date) %>% summarise(avgPM = mean(Closing.Price..USD.)) %>% as_tsibble(index = Date)

z_eth %>% #TSIBBLE
autoplot() +
labs(y = "Closing price", x="Date")

z_eth %>% gg_season(avgPM)

z_eth_deco <- z_eth %>% model(STL(avgPM)) #MABLE

z_eth_test <- z_eth %>% slice(1:floor(.75nrow(z_eth)))
z_eth_out <- z_eth %>% slice((floor(.75
nrow(z_eth)):n()))

z_eth_deco %>%
gg_tsresiduals()

moreDat <- z_eth_deco %>% augment

moreDat %>% features(.innov, box_pierce, lag = 10, dof = 0)

moreDat %>% autoplot(.innov) + ylab("Residuals")

xDec <- z_eth %>% features(avgPM, feat_stl)

components(z_eth_deco) %>% as_tsibble() %>% autoplot(avgPM) +
geom_line(aes(y=trend), colour = "#D55E00") + #Why it shows seasonality if there is none.
geom_line(aes(y=remainder), colour = "blue") +
geom_line(aes(y=season_year), colour = "red")

ets_mod <- z_eth_test %>%
model(ets = ETS(avgPM ~ error("N") + trend("M") + season("N")))

ets_mod_auto <- z_eth_test %>%
model(ets = ETS(avgPM))

ets_mod_auto %>% report()

forecastLen <- length(z_eth_out$avgPM)
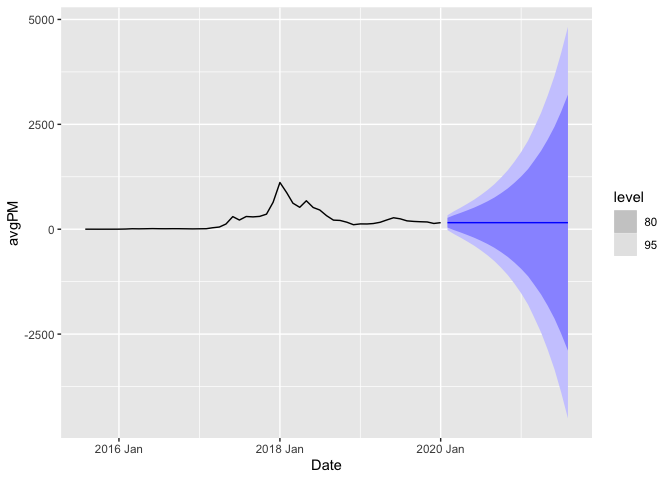
fc <- ets_mod_auto %>% forecast(h = forecastLen) #use namespace to not confuse with other packages ::

fc %>% autoplot()
fc %>%
hilo(level = c(80, 95))

fc %>% autoplot(z_eth_test)

I downloadeded the data for "all" and used dput(z_eth) for the z_eth from your code to create a reprex. I highly recommend a reprex when asking for help rather than giving a link to the data source.

The report for the ETS model is (M, N, N) with alpha = 0.9999 which is essentially a random walk (0.9999 is VERY close to 1) with no trend or seasonality. The best forecast for next month is the value for this month, and the best forecast two months ahead is also the value for this month, and so on.

BTW, you cannot specify an ETS model with "N" for the error.

suppressPackageStartupMessages(library(fpp3))

z_eth <- structure(list(Date = structure(c(16648, 16679, 16709, 16740, 
                                  16770, 16801, 16832, 16861, 16892, 16922, 16953, 16983, 17014, 
                                  17045, 17075, 17106, 17136, 17167, 17198, 17226, 17257, 17287, 
                                  17318, 17348, 17379, 17410, 17440, 17471, 17501, 17532, 17563, 
                                  17591, 17622, 17652, 17683, 17713, 17744, 17775, 17805, 17836, 
                                  17866, 17897, 17928, 17956, 17987, 18017, 18048, 18078, 18109, 
                                  18140, 18170, 18201, 18231, 18262, 18293, 18322, 18353, 18383, 
                                  18414, 18444, 18475, 18506, 18536, 18567, 18597, 18628, 18659, 
                                  18687, 18718, 18748, 18779, 18809), class = c("yearmonth", "vctrs_vctr"
                                  )), avgPM = c(1.23852533333333, 0.9886999, 0.658164483870968, 
                                                0.9298494, 0.884815612903226, 1.52380051612903, 4.56761544827586, 
                                                11.1117932258065, 8.94574076666667, 11.2940913870968, 14.3731418333333, 
                                                11.8619731290323, 11.1576918387097, 12.5251499, 11.9651156774194, 
                                                9.97532326666667, 7.83666051612903, 10.1742568064516, 12.3853898928571, 
                                                34.7225876451613, 52.3605244333333, 123.960254451613, 300.6547521, 
                                                218.722350387097, 303.158966322581, 294.156990966667, 305.894181193548, 
                                                359.124333333333, 641.457032258064, 1113.998, 869.379892857143, 
                                                620.773193548387, 522.326833333333, 677.957947810119, 517.89819497206, 
                                                458.05772890401, 322.089121932106, 216.96889225722, 209.305132020477, 
                                                167.11591145233, 107.386815756542, 126.543917432639, 125.176889637093, 
                                                135.447403060861, 165.22808085934, 220.055176293835, 273.241196658867, 
                                                248.296865524552, 199.408394750545, 185.74948856629, 178.407611010639, 
                                                172.9819384357, 137.217722594039, 156.424866406223, 239.049834639276, 
                                                161.301471952526, 172.02663204292, 208.082405478535, 236.020492827033, 
                                                259.911378254903, 402.062691077539, 368.711580995463, 376.255336613523, 
                                                486.478629431027, 622.155608773077, 1201.59379454444, 1696.35929772083, 
                                                1732.52175932552, 2294.56742548414, 3147.8595091409, 2328.87417013744, 
                                                2141.12849792455)), row.names = c(NA, -72L), key = structure(list(
                                                  .rows = structure(list(1:72), ptype = integer(0), class = c("vctrs_list_of", 
                                                                                                              "vctrs_vctr", "list"))), row.names = c(NA, -1L), class = c("tbl_df", 
                                                                                                                                                                         "tbl", "data.frame")), index = structure("Date", ordered = TRUE), index2 = "Date", interval = structure(list(
                                                                                                                                                                           year = 0, quarter = 0, month = 1, week = 0, day = 0, hour = 0, 
                                                                                                                                                                           minute = 0, second = 0, millisecond = 0, microsecond = 0, 
                                                                                                                                                                           nanosecond = 0, unit = 0), .regular = TRUE, class = c("interval", 
                                                                                                                                                                                                                                 "vctrs_rcrd", "vctrs_vctr")), class = c("tbl_ts", "tbl_df", "tbl", 
                                                                                                                                                                                                                                                                         "data.frame"))
z_eth_test <- z_eth %>% slice(1:floor(.75*nrow(z_eth)))
z_eth_out <- z_eth %>% slice((floor(.75*nrow(z_eth)):n()))

ets_mod_auto <- z_eth_test %>%
  model(ets = ETS(avgPM))
ets_mod_auto %>% report()
#> Series: avgPM 
#> Model: ETS(M,N,N) 
#>   Smoothing parameters:
#>     alpha = 0.9999 
#> 
#>   Initial states:
#>       l[0]
#>  0.9869478
#> 
#>   sigma^2:  0.3323
#> 
#>      AIC     AICc      BIC 
#> 593.5255 594.0055 599.4925

fc <- ets_mod_auto %>% forecast(h = length(z_eth_out$avgPM))
fc %>% autoplot(z_eth_test)

Created on 2021-07-16 by the reprex package (v2.0.0)

1 Like

Thank you, I will try to use reprex in the future.

How did you get the output of dput ? I tried to get it with the reprex() But then i have # in front of every row which can be problematic for long data.

I ran your code

csv_data_1 <- read.csv("ETH_USD_CoinDesk.csv")

z_eth <- mutate(csv_data_1, Currency = NULL, X24h.High..USD. = NULL, X24h.Low..USD.=NULL, X24h.Open..USD.=NULL) %>%
mutate(Date = yearmonth(Date)) %>% group_by(Date) %>% summarise(avgPM = mean(Closing.Price..USD.)) %>% as_tsibble(index = Date)

and then ran dput(z_eth) in the console. I copied the output that appeared in the console and pasted it at the start of the code for my reprex.

1 Like

This topic was automatically closed 7 days after the last reply. New replies are no longer allowed.

If you have a query related to it or one of the replies, start a new topic and refer back with a link.