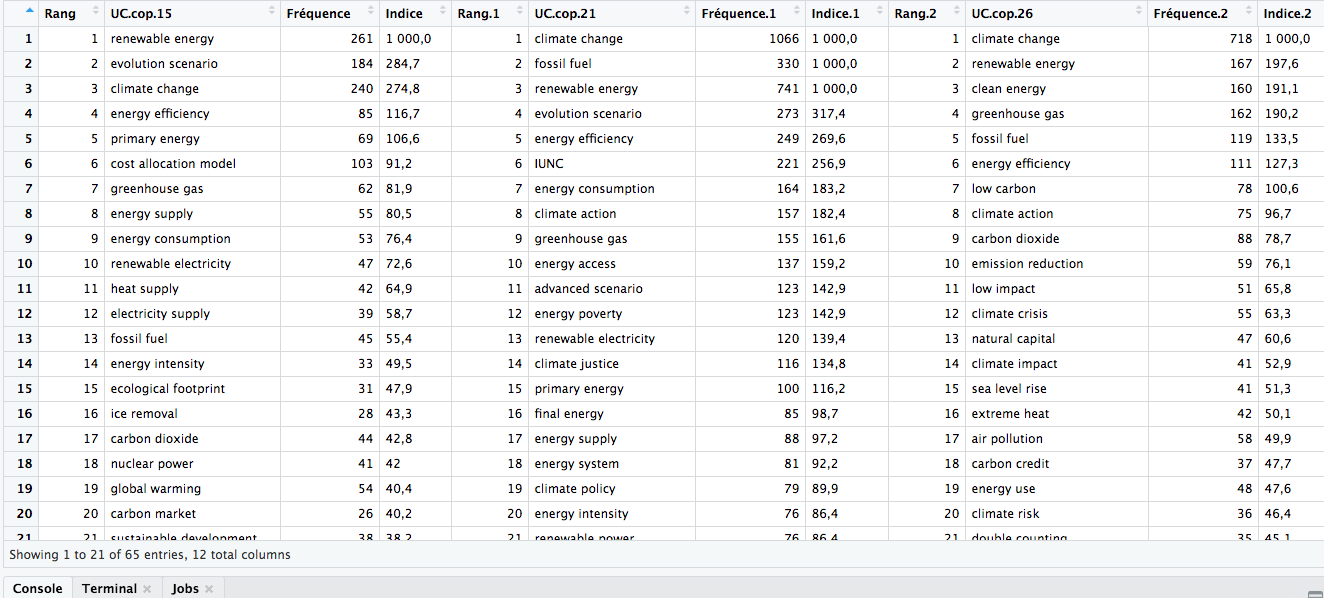
I would like R to retrieve all the character values that are similar in the columns "UC.cop.15", "UC.cop.21", and "UC.cop.25", which means that it should compare the values in these three columns (see screenshot of the dataframe attached)
. For instance, I would like it to identify that "climate change" is present in the three columns, and to paste the numerical data associated to each instance of "climate change" (rang, Fréquence and indice), so that I can compare these numerical data between the different instances. I am new to R so I don't have much functions in mind. I have tried "neo[neo$UC.cop.15==neo$UC.cop.21,], but the result was 0, as I think it looked for the instances where the similar terms belong to the same row, which is never the case in my dataframe.
Thank you in advance to those who will take the time to read me and answer!!
Welcome to the forum.
I think to work with your data, it's easier first to change the shape of it so you then can do more easy comparisons. When you post next time, read the reprex guide first to see how you can more easily share data (instead of screenshot ).
A reprex consists of the minimal code and data needed to recreate the issue/question you're having. You can find instructions how to build and share one here:
library(tidyverse)

# --- REARRANGE DATA

#Dummy data
myData = data.frame(
  rank1 = 1:5,
  category1 = LETTERS[1:5],
  freq1 = sort(runif(5, 10, 500), decreasing = T),
  index1 = sort(runif(5, 50, 100), decreasing = T),
  rank2 = 1:5,
  category2 = LETTERS[3:7],
  freq2 = sort(runif(5, 10, 500), decreasing = T),
  index2 = sort(runif(5, 50, 100), decreasing = T)
)
myData
#>   rank1 category1     freq1   index1 rank2 category2     freq2   index2
#> 1     1         A 290.77579 99.62580     1         C 429.53147 96.53265
#> 2     2         B 253.47117 83.76906     2         D 260.76972 94.01472
#> 3     3         C 204.33145 75.40200     3         E 236.83461 92.82498
#> 4     4         D 180.30147 63.70797     4         F 199.06805 83.95600
#> 5     5         E  11.42078 55.96340     5         G  92.88799 51.39425

#Save the number of rows
totalRows = nrow(myData)

#Paste similar columns together
myData = rbind(
  setNames(myData[,1:4], c("rank", "category", "freq", "index")),
  setNames(myData[,5:8], c("rank", "category", "freq", "index"))
)

#Make sure to name the data coming from different columns
myData$group = rep(c("group1", "group2"), each = totalRows)
myData
#>    rank category      freq    index  group
#> 1     1        A 290.77579 99.62580 group1
#> 2     2        B 253.47117 83.76906 group1
#> 3     3        C 204.33145 75.40200 group1
#> 4     4        D 180.30147 63.70797 group1
#> 5     5        E  11.42078 55.96340 group1
#> 6     1        C 429.53147 96.53265 group2
#> 7     2        D 260.76972 94.01472 group2
#> 8     3        E 236.83461 92.82498 group2
#> 9     4        F 199.06805 83.95600 group2
#> 10    5        G  92.88799 51.39425 group2

# --- ANALYSE DATA (using Tidyverse functions)

#Example, sort by category
myData %>% arrange(category)
#>    rank category      freq    index  group
#> 1     1        A 290.77579 99.62580 group1
#> 2     2        B 253.47117 83.76906 group1
#> 3     3        C 204.33145 75.40200 group1
#> 4     1        C 429.53147 96.53265 group2
#> 5     4        D 180.30147 63.70797 group1
#> 6     2        D 260.76972 94.01472 group2
#> 7     5        E  11.42078 55.96340 group1
#> 8     3        E 236.83461 92.82498 group2
#> 9     4        F 199.06805 83.95600 group2
#> 10    5        G  92.88799 51.39425 group2

#Example, group by category and look who is present
myData %>% group_by(category) %>%
  summarise(
    n = n(),
    presentIn = paste(group, collapse = ","),
    avgFreq = mean(freq))
#> `summarise()` ungrouping output (override with `.groups` argument)
#> # A tibble: 7 x 4
#>   category     n presentIn     avgFreq
#>   <chr>    <int> <chr>           <dbl>
#> 1 A            1 group1          291.
#> 2 B            1 group1          253.
#> 3 C            2 group1,group2   317.
#> 4 D            2 group1,group2   221.
#> 5 E            2 group1,group2   124.
#> 6 F            1 group2          199.
#> 7 G            1 group2           92.9
The first part of the code is transforming the data into a longer format by parsing columns together into long rows, but adding an extra column group to know which column they originally belonged to.
Then you can use the Tidyverse dplyr functions to start doing some great summaries / anayses. I included a few examples.