Hi,
I just want to export my data I got using the describeBy() function as table to ultimately use in my Thesis written in Word. Preferebly so that I can still process it.
I spent a lot of time googling for an answer, but I couldn't find a workable sollution for this rather simple problem. I would be thrilled if someone could help me as soon as possible, maybe even today!
Hello,
if you have just a few tables, this might serve your needs:
data <- mtcars
library(psych)
describeBy(data, group = data$cyl) |> str()
#> List of 3
#>  $ 4:Classes 'psych', 'describe' and 'data.frame':   11 obs. of  13 variables:
#>   ..$ vars    : int [1:11] 1 2 3 4 5 6 7 8 9 10 ...
#>   ..$ n       : num [1:11] 11 11 11 11 11 11 11 11 11 11 ...
#>   ..$ mean    : num [1:11] 26.66 4 105.14 82.64 4.07 ...
#>   ..$ sd      : num [1:11] 4.51 0 26.872 20.935 0.365 ...
#>   ..$ median  : num [1:11] 26 4 108 91 4.08 2.2 18.9 1 1 4 ...
#>   ..$ trimmed : num [1:11] 26.44 4 104.3 82.67 4.02 ...
#>   ..$ mad     : num [1:11] 6.523 0 42.995 32.617 0.341 ...
#>   ..$ min     : num [1:11] 21.4 4 71.1 52 3.69 ...
#>   ..$ max     : num [1:11] 33.9 4 146.7 113 4.93 ...
#>   ..$ range   : num [1:11] 12.5 0 75.6 61 1.24 ...
#>   ..$ skew    : num [1:11] 0.2592 NaN 0.12059 0.00626 0.99812 ...
#>   ..$ kurtosis: num [1:11] -1.645 NaN -1.635 -1.709 0.123 ...
#>   ..$ se      : num [1:11] 1.36 0 8.1 6.31 0.11 ...
#>  $ 6:Classes 'psych', 'describe' and 'data.frame':   11 obs. of  13 variables:
#>   ..$ vars    : int [1:11] 1 2 3 4 5 6 7 8 9 10 ...
#>   ..$ n       : num [1:11] 7 7 7 7 7 7 7 7 7 7 ...
#>   ..$ mean    : num [1:11] 19.74 6 183.31 122.29 3.59 ...
#>   ..$ sd      : num [1:11] 1.454 0 41.562 24.26 0.476 ...
#>   ..$ median  : num [1:11] 19.7 6 167.6 110 3.9 ...
#>   ..$ trimmed : num [1:11] 19.74 6 183.31 122.29 3.59 ...
#>   ..$ mad     : num [1:11] 1.9274 0 11.2678 7.413 0.0297 ...
#>   ..$ min     : num [1:11] 17.8 6 145 105 2.76 2.62 15.5 0 0 3 ...
#>   ..$ max     : num [1:11] 21.4 6 258 175 3.92 ...
#>   ..$ range   : num [1:11] 3.6 0 113 70 1.16 0.84 4.72 1 1 2 ...
#>   ..$ skew    : num [1:11] -0.158 NaN 0.795 1.358 -0.736 ...
#>   ..$ kurtosis: num [1:11] -1.907 NaN -1.229 0.249 -1.401 ...
#>   ..$ se      : num [1:11] 0.549 0 15.709 9.17 0.18 ...
#>  $ 8:Classes 'psych', 'describe' and 'data.frame':   11 obs. of  13 variables:
#>   ..$ vars    : int [1:11] 1 2 3 4 5 6 7 8 9 10 ...
#>   ..$ n       : num [1:11] 14 14 14 14 14 14 14 14 14 14 ...
#>   ..$ mean    : num [1:11] 15.1 8 353.1 209.21 3.23 ...
#>   ..$ sd      : num [1:11] 2.56 0 67.771 50.977 0.372 ...
#>   ..$ median  : num [1:11] 15.2 8 350.5 192.5 3.12 ...
#>   ..$ trimmed : num [1:11] 15.15 8 349.63 203.67 3.19 ...
#>   ..$ mad     : num [1:11] 1.557 0 73.389 44.478 0.156 ...
#>   ..$ min     : num [1:11] 10.4 8 275.8 150 2.76 ...
#>   ..$ max     : num [1:11] 19.2 8 472 335 4.22 ...
#>   ..$ range   : num [1:11] 8.8 0 196.2 185 1.46 ...
#>   ..$ skew    : num [1:11] -0.363 NaN 0.453 0.909 1.341 ...
#>   ..$ kurtosis: num [1:11] -0.5655 NaN -1.2591 0.0921 1.0771 ...
#>   ..$ se      : num [1:11] 0.6842 0 18.1126 13.6241 0.0995 ...
#>  - attr(*, "dim")= int 3
#>  - attr(*, "dimnames")=List of 1
#>   ..$ group: chr [1:3] "4" "6" "8"
#>  - attr(*, "call")= language by.data.frame(data = x, INDICES = group, FUN = describe, type = type)
#>  - attr(*, "class")= chr [1:2] "psych" "describeBy"
# The result is a list of 3
# each entry is a data.frame with additinal 'describe' and 'psych' classes
my_descriptions <- describeBy(data, group = data$cyl)
library(tidyverse)
write_excel_csv(my_descriptions[[1]], file = 'my_descriptions.csv')
# if you want separate files, just use another filename
write_excel_csv(my_descriptions[[2]], file = 'my_descriptions.csv', append = TRUE)
write_excel_csv(my_descriptions[[3]], file = 'my_descriptions.csv', append = TRUE)
Created on 2022-08-25 by the reprex package (v2.0.1)
If you have many more, you might consider
- using
lapply()orpurrr::walk()to go through your output list - employing a for loop of some sort
Kind regards
Edit: To write to an ordinary Excel-file, you might use packages like xlsx. But some of them are problematic because of problems with Java. So using .csv and rearranging it in Excel might be the safest option.
Thanks for your fast answer! but my Problem is still not completly solved.
My data looks like this
#> > describeBy(Azores_Seabirds$d13C, Azores_Seabirds$Species_lat)

 Descriptive statistics by group
group: Bulweria_bulwerii
   vars  n   mean  sd median trimmed  mad    min    max range  skew kurtosis   se
X1    1 27 -17.98 1.2 -17.79  -17.97 1.56 -20.05 -16.05  4.01 -0.06    -1.39 0.23
---------------------------------------------------------------------------
group: Calonectris_borealis
   vars  n   mean   sd median trimmed  mad    min    max range skew kurtosis   se
X1    1 63 -17.97 0.97 -18.06  -18.06 1.18 -19.41 -15.51   3.9 0.58    -0.61 0.12
---------------------------------------------------------------------------
group: Hydrobates_monteroi
   vars  n   mean   sd median trimmed  mad    min    max range skew kurtosis   se
X1    1 60 -19.05 0.87 -19.22  -19.07 0.76 -20.53 -17.29  3.24 0.32    -0.89 0.11
---------------------------------------------------------------------------
group: Puffinus_assimilis
   vars n   mean   sd median trimmed  mad    min    max range skew kurtosis   se
X1    1 7 -17.86 0.34 -17.93  -17.86 0.21 -18.39 -17.27  1.12 0.19    -0.93 0.13
---------------------------------------------------------------------------
group: Sterna_dougallii
   vars n   mean   sd median trimmed  mad    min   max range  skew kurtosis   se
X1    1 9 -18.57 0.34 -18.59  -18.57 0.41 -19.02 -18.1  0.92 -0.06    -1.74 0.11
---------------------------------------------------------------------------
group: Sterna_hirundo
   vars  n   mean   sd median trimmed  mad    min    max range skew kurtosis  se
X1    1 18 -18.61 1.26 -18.63   -18.7 1.51 -20.27 -15.59  4.69 0.54     -0.4 0.3
> write_excel_csv(table1, file = 'table1.csv')
Error in write_excel_csv(table1, file = "table1.csv") :
  is.data.frame(x) ist nicht TRUE
> table1 <- describeBy(Azores_Seabirds$d13C, Azores_Seabirds$Species_lat)
>
> write_excel_csv(table1, file = 'table1.csv')
Error in write_excel_csv(table1, file = "table1.csv") :
  is.data.frame(x) ist nicht TRUE
> Seabirds_summary <- describeBy(Azores_Seabirds$d13C, Azores_Seabirds$Species_lat)
>
> write_excel_csv(Seabirds_summary, file = 'Seabirds_summary.csv')
Error in write_excel_csv(Seabirds_summary, file = "Seabirds_summary.csv") :
  is.data.frame(x) ist nicht TRUE
> write_excel_csv(Seabirds_summary[[1]], file = 'Seabirds_summary.csv')
> write_excel_csv(Seabirds_summary[[1]], file = 'Seabirds_summary.csv')
> describeBy(Azores_Seabirds$d13C, Azores_Seabirds$Species_lat)

 Descriptive statistics by group
group: Bulweria_bulwerii
   vars  n   mean  sd median trimmed  mad    min    max range  skew kurtosis   se
X1    1 27 -17.98 1.2 -17.79  -17.97 1.56 -20.05 -16.05  4.01 -0.06    -1.39 0.23
---------------------------------------------------------------------------
group: Calonectris_borealis
   vars  n   mean   sd median trimmed  mad    min    max range skew kurtosis   se
X1    1 63 -17.97 0.97 -18.06  -18.06 1.18 -19.41 -15.51   3.9 0.58    -0.61 0.12
---------------------------------------------------------------------------
group: Hydrobates_monteroi
   vars  n   mean   sd median trimmed  mad    min    max range skew kurtosis   se
X1    1 60 -19.05 0.87 -19.22  -19.07 0.76 -20.53 -17.29  3.24 0.32    -0.89 0.11
---------------------------------------------------------------------------
group: Puffinus_assimilis
   vars n   mean   sd median trimmed  mad    min    max range skew kurtosis   se
X1    1 7 -17.86 0.34 -17.93  -17.86 0.21 -18.39 -17.27  1.12 0.19    -0.93 0.13
---------------------------------------------------------------------------
group: Sterna_dougallii
   vars n   mean   sd median trimmed  mad    min   max range  skew kurtosis   se
X1    1 9 -18.57 0.34 -18.59  -18.57 0.41 -19.02 -18.1  0.92 -0.06    -1.74 0.11
---------------------------------------------------------------------------
group: Sterna_hirundo
   vars  n   mean   sd median trimmed  mad    min    max range skew kurtosis  se
X1    1 18 -18.61 1.26 -18.63   -18.7 1.51 -20.27 -15.59  4.69 0.54     -0.4 0.3
> Seabirds_summary <- describeBy(Azores_Seabirds$d13C, Azores_Seabirds$Species_lat)
>
> write_excel_csv(Seabirds_summary[[1]], file = 'Seabirds_summary.csv')
But my excel output is quite messy

Any Idea how to correct that?
You have a german Excel version (greetings from another German ![]()
![]() ), so consider using
), so consider using readr::write_excel_csv2() or go to Daten > Text in Spalten (but keep the relevant column A selected). Then go through the specs in Excel.
But it will be easier to use readr::write_excel_csv2() I think.
Now I got this Problem
#>> Seabirds_summary <- describeBy(Azores_Seabirds$d13C, Azores_Seabirds$Species_lat)
> readr::write_excel_csv2(Seabirds_summary)
Error in readr::write_excel_csv2(Seabirds_summary) :
  is.data.frame(x) ist nicht TRUE
I am quite new to R, so I am always a bit helpless if any Errors occur ![]()
(If it is easier, we could use german as well ![]() )
)
Maybe this is a desired result for you
# you can write the descriptions to excel with lapply
# (but won't have the group as separate column and no header since you need append = TRUE)
lapply(my_descriptions, readr::write_excel_csv2, file = 'my_descriptions.csv', append = TRUE)

# you could combine the results and add an id
library(data.table)
readr::write_excel_csv2(rbindlist(my_descriptions, idcol = 'group'), file = 'my_descriptions.csv')
Created on 2022-08-25 by the reprex package (v2.0.1)
Regarding your latest post:
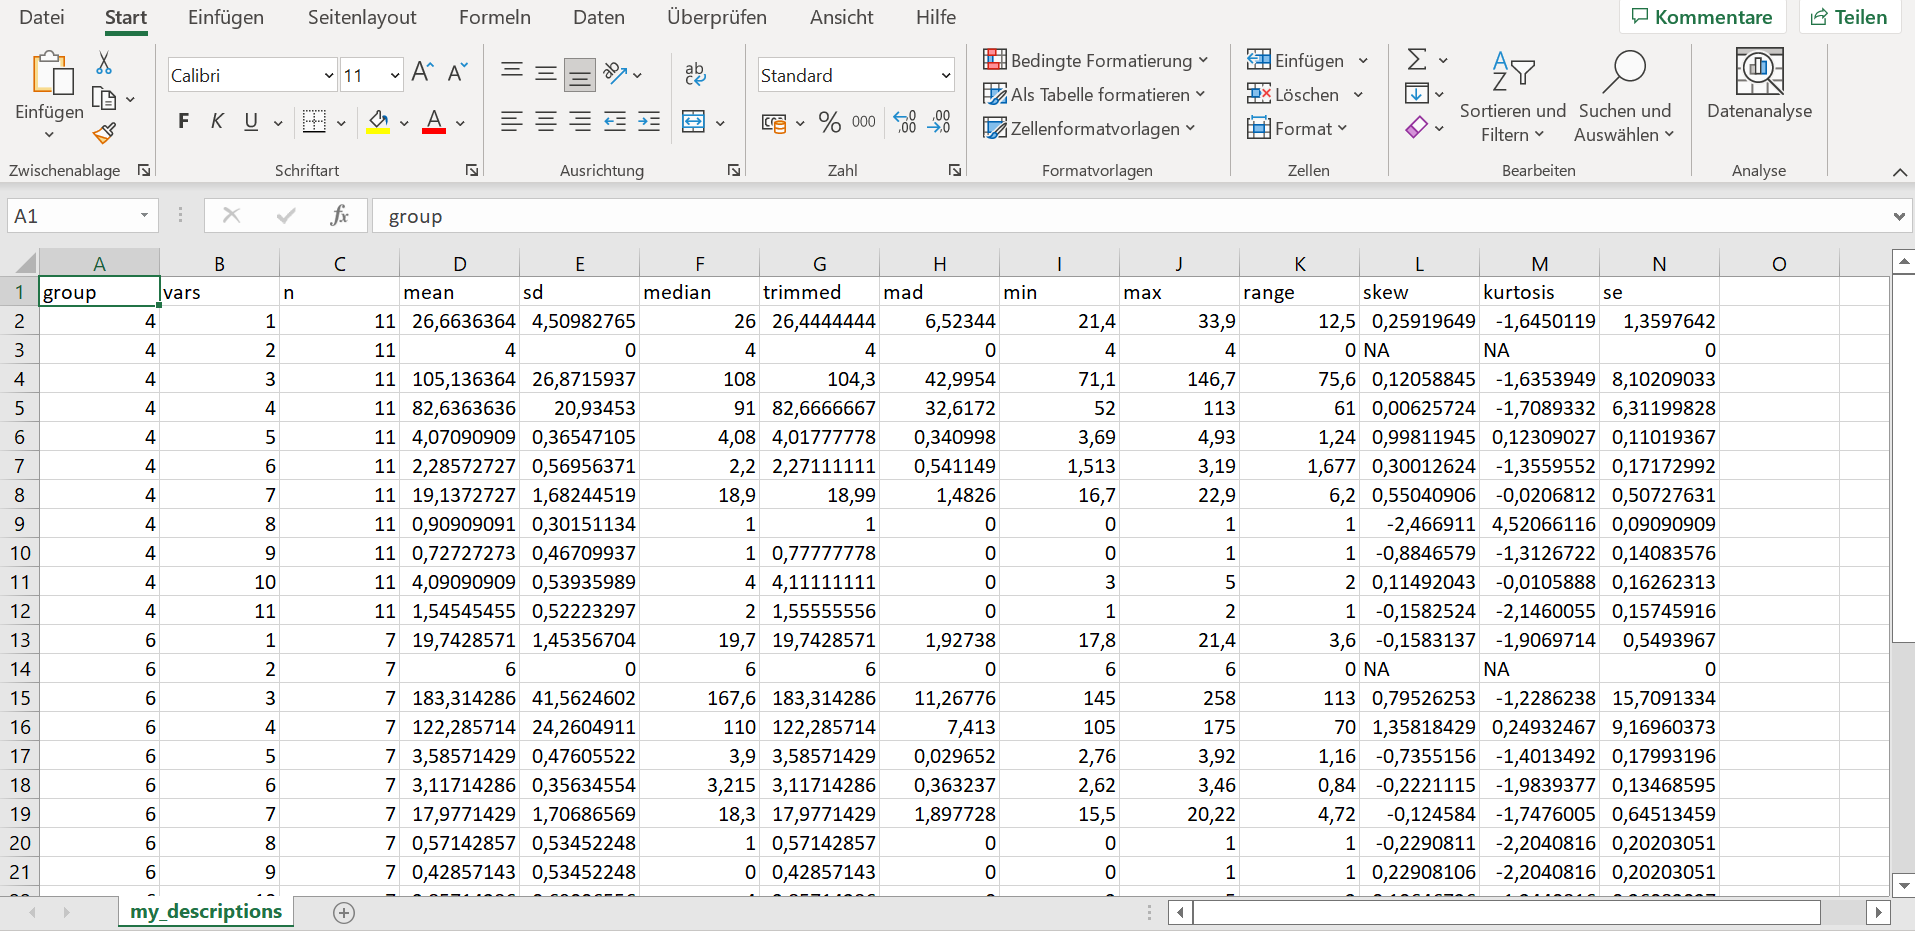
You have a list of data.frames as output of psych::describeBy(). If you pass it to readr::write_excel_csv2(), it cannot handle it since the function is supposed to write just a single data.frame (and not a list of multiple) to an Excel-file. Apply the code above (the second approach) and you will be fine, because data.table::rbindlist() takes care of combining your results and the argument idcol creates a new column in the combined data.frame with the current group as entry.
It will look like this (for mtcarsat the very least):
Kind regards
Edit: Since it is an english forum, writing german would be confusing for later users which may have a similar problem as you. ![]() If you have any further questions regarding my solution, feel free to ask.
If you have any further questions regarding my solution, feel free to ask.
Thank you very much!!!
This time it worked

Now that I got this code, I should be able to apply it to my ohter results. If any other problems occur, I will ask again
This topic was automatically closed 7 days after the last reply. New replies are no longer allowed.
If you have a query related to it or one of the replies, start a new topic and refer back with a link.