I have been working on a retention analysis of for a subscription business. A stakeholder asked me if I could do some analysis to model what improved retention could look like under various 't-shirt sized' scenarios e.g. 'moderately improved' , 'substantially improved', 'no change'.
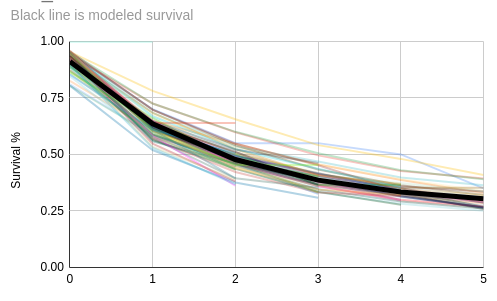
After analysis of monthly cohorts using ggplot and non linear regression, I believe I have a model that fits our data well. Here's a chart showing cohorts oscillating around the modeled retention rate for each billing cycle (x-axis).
:
The function I used here was:
exponential_decay <- function(i, a, lambda, billing_cycle) i + a * exp(-lambda * billing_cycle)
Suppose using nls() I got the following model params:
i=0.25
a=0.65
lambda=0.55
standard_error of lambda=0.02
My original goal:
model what improved retention could look like under various 't-shirt sized' scenarios
I focused on the parameter lambda and shifted it by standard errors. The closer lambda is to 0, the greater the survival rate. So I looked at the same modeled curve by t-shirt size:
- moderately improved = lambda - ( 1 * 0.02) = 0.53
- substantially improved = lambda - (2 * 0.02) = 0.51
More than 2 standard errors would be outside of 95% confidence.
I have not modeled retention in this way before. Is what I'm doing 'right'? Is this a sound approach to modeling improved retention?
Aside, can I call my function 'exponential decay'? From searching online and reviewing text books, the 'regular' exponential decay model would not include a constant i nor a coefficient a. But including these params helped my data fit better. What would I call this functional form?