Hi @Boltimar , remember put a reproducible example of data an example is there:
Reproducible example of data
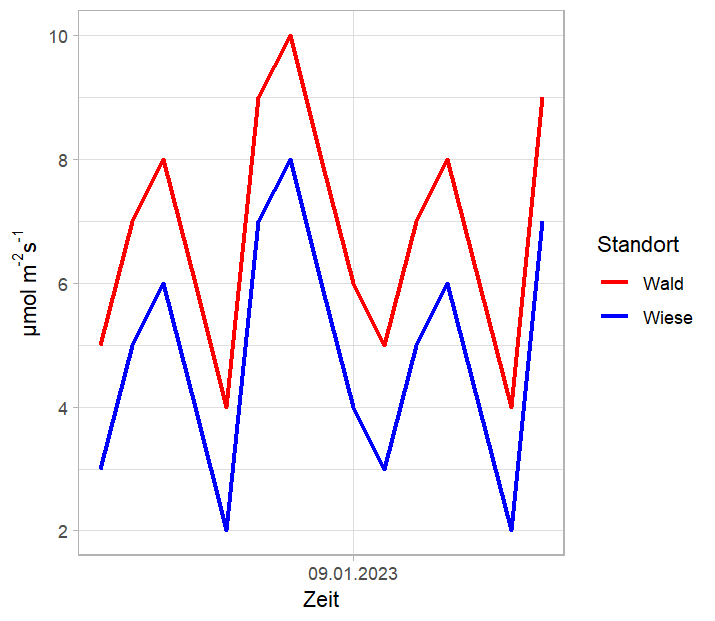
With a toy data, I'm suggest you this:
GoeW_EK_daily <- data.frame(
  TIMESTAMP = seq(as.Date("2023-01-01"), as.Date("2023-01-15"), by = "days"),
  ET_f = c(5, 7, 8, 6, 4, 9, 10, 8, 6, 5, 7, 8, 6, 4, 9))

FBG_EK_daily <- data.frame(
  TIMESTAMP = seq(as.Date("2023-01-01"), as.Date("2023-01-15"), by = "days"),
  ET_f = c(3, 5, 6, 4, 2, 7, 8, 6, 4, 3, 5, 6, 4, 2, 7))

ggplot() +
  geom_line(data = GoeW_EK_daily, aes(x = TIMESTAMP, y = ET_f, color = "Wald"), linewidth = 1) +
  geom_line(data = FBG_EK_daily, aes(x = TIMESTAMP, y = ET_f, color = "Wiese"), linewidth = 1) +
  labs(x = "Zeit",
       y = expression(paste("\u03BCmol m"^"-2","s"^"-1")),  # put in  " " the text
       color = "Standort") +
  scale_color_manual(values = c("Wald" = "red", "Wiese" = "blue")) +
  theme_light() +
  scale_x_date(date_breaks = "2 week", date_labels = "%d.%m.%Y")