Hi,
I'm new to R and I need your help. ChatGPT and Bard didn't help me so far, so I'm trying my luck here.
It's about the following code:
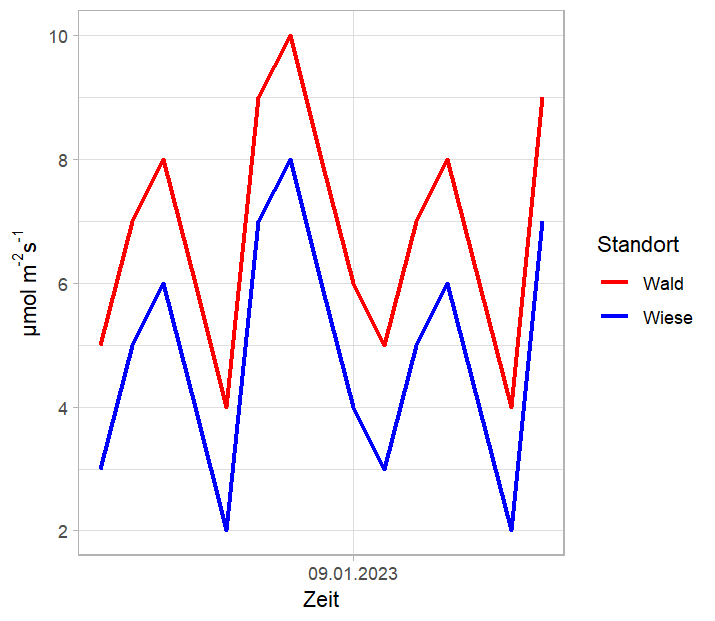
ggplot() + geom_line(data = GoeW_EK_daily, aes(x = TIMESTAMP, y = ET_f, color = "Wald"), linewidth = 1) + geom_line(data = FBG_EK_daily, aes(x = TIMESTAMP, y = ET_f, color = "Wiese"), linewidth = 1) + labs(x = "Zeit", y = expression(paste("\u03BCmol m^-2 s^-1" )), color = "Standort") + scale_color_manual(values = c("Wald" = "red", "Wiese" = "blue")) + theme_light() + scale_x_date(date_breaks = "2 week", date_labels = "%d.%m.%Y")
I want to display the -2 and -1 as exponents in the line labs. I tried a few versions, but none of them could display both numbers at the same time. Do you have any idea how this can work?
Thanks for your help!