Explore Your Researcher Degrees of Freedom
Authors: Joachim Gassen
Working with Shiny for 1+ years
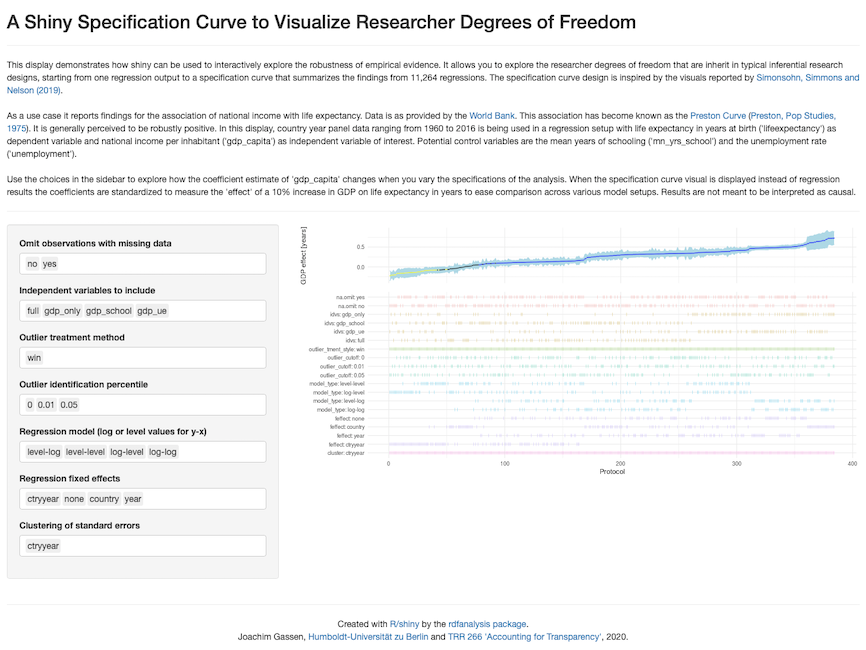
Abstract: This shiny app lets you interactively explore the robustness of empirical evidence. It allows you to explore the researcher degrees of freedom that are inherit in typical inferential research designs, starting from one regression output to a specification curve that summarizes the findings from 11,264 regressions.
Full Description: Each research design contains choices. How should data be selected, variables defined and models specified? The resulting choices have been characterized as researcher degrees of freedom.
The challenge is not only to identify these choices that are best supported by theory, but also how to efficiently communicate the robustness of the empirical findings across all reasonable alternative research protocols.
The in-development package {rdfanalysis} provides a code infrastructure that allows researchers to specify, document and explore their researcher degrees of freedom when conducting an inferential statistical analysis. The shiny app that is integrated in the package presents an interactive variant of the specification curve (introduced into the literature by Simonsohn, Simmons and Nelson (2019)). It allows researchers to explore the robustness of a specified research design along multiple dimensions in a flexible and intuitive way.
Category: Research
Keywords: Research, Regression Analysis, Visualization, Open Science
Shiny app: https://jgassen.shinyapps.io/shiny_rdf_spec_curve/
Repo: GitHub - joachim-gassen/rdfanalysis: Analyse your researcher degrees of freedom
RStudio Cloud: Posit Cloud
Thumbnail:
Full image: