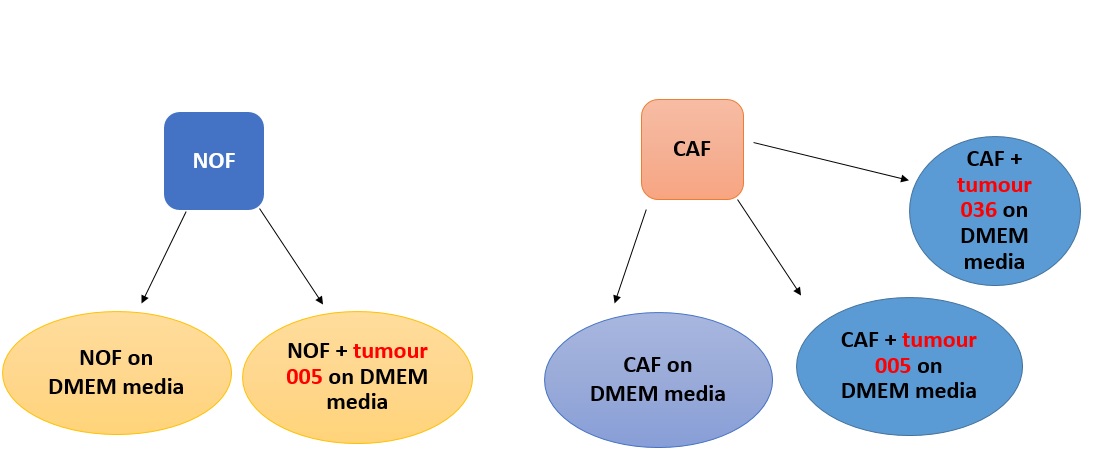
I have a Normal esophageal Fibroblasts (NOFs) cultured in DMEM media; The same NOF also have been cultured with a tumor sample from a patient named 005 on DMEM media; I have also Cancer Associated Fibroblasts (CAFs) cultured on DMEM, on DMEM + tumor from a patient named as 005 and DMEM + tumor from a patient named 036 something like this picture;
So, this is a classification problem, where the outcome Y is binary: NOF and COF are associated with one or more gene expressions (TRUE) or not (FALSE). Conventionally, your null hypothesis is that there is no association. Your task is to develop the appropriate test statistic to estimate \hat{Y} and make a judgment, before hand is what you will expect as a value of that statistic sufficient to make the call on rejecting the null hypothesis and what statistical confidence interval would be useful.
Unless there's a quantitative variable hiding in your data somewhere ANOVA , there's no variance or standard deviation to analyze. You have observations of patients and a series of T/F measures, NOF, CAF, TUMOR, GENE\_i, ... GENE\_n that the patient either expresses or fails to express. If you load
library(edgeR)
edgeRUsersGuide()
you'll see that the documentation talks about ANOVA-like functions only.
BTW: library names in R are case-sensitive.
A workflow for gene expression will get you started with populating patient gene expression with DESeq2. Once you have those
library(edgeR)
edgeRUsersGuide()
and carefully review § 4.1 RNA-Seq of oral carcinomas vs matched normal tissue to see how generalized linear models glm are tailed in edgeR for your domain problem.
Thanks a lot, but I have gene expression messurment for these comparision. I mean I have raw count data coming from Edgeseq platform. I am just wondering, could I ignore CAFs coming from different patients and suppose them as replication for comparing NOFs and CAFs or I will need a more complex disign to come up with confounding factors
With gene expression in place, that probably simplifies your work a lot!
We're beginning to stray from specific R related questions a bit, and you may have much more informed viewpoints in a BioConductor specific forum, especially if you're seeking to draw causal inferences from observational data. There are someR packages that deal with the Pearl DAG approach to experimental design, including dagR. (You might want to review an article the author cites: Greenland S, Pearl J, Robins JM (1999). Causal diagrams for epidemiologic research. Epidemiology 10(1):37-48 if you're familiar with casual inference analysis through directed acyclic diagrams; if not, Pearl's blog is probably a gateway to everything on the topic.
As gut level reaction from a non-specialist and, again assuming I understand the statement correctly, an analysis of gene expression in a single tissue observation that has been treated compared to the gene expressions of some other number of patients who have not been, doesn't seem promising from a statistical standpoint.