I am experiencing a crash in my R script and I have opening another R script and it still does the same thing. please I need assistance.
Here is a copy of the crash message.
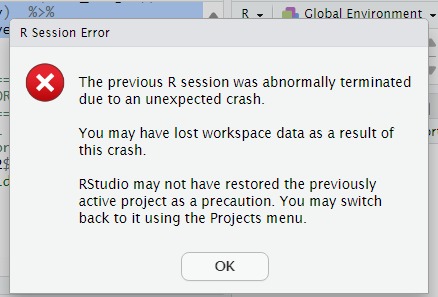
If you don't need the workspace saved between sessions: the way RStudio remembers variables, functions and values when you start a new session/ re-open it, you can go to Tools \rightarrow global options \rightarrow general and disable saving and loading workspace.
If you must have workspace saving and auto loading you might need to reinstall RStudio with privileges.
I think we need to see your code and some sample data. See
Just copy your code and paste it here between
```
```
A handy way to supply some sample data is the dput() function. In the case of a large dataset something like dput(head(mydata, 100)) should supply the data we need. Just do dput(mydata) where mydata is your data. Copy the output and paste it here between
```
```
It probably would also help to see the output of
sessionInfo()
Alright.
Thanks for your response.
I am working on the Cyclistic capstone project
  mutate(weekday = wday(started_at, label = TRUE)) %>%
  group_by(member_casual, weekday) %>%
  summarise(number_of_rides = n()
            ,average_duration = mean(ride_length)) %>%
  arrange(member_casual, weekday)  %>%
  ggplot(aes(x = weekday, y = average_duration, fill = member_casual)) +
geom_col(position = "dodge")```sessionInfo(Divvy_Trips_2019_Q1)
Error in if (pkg == "base") file.path(.Library, "base") else if (isNamespaceLoaded(pkg)) getNamespaceInfo(pkg, :
the condition has length > 1
Cyclistic capstone project ? Oh, it looks like it's Google data project. Is the data downloaded from kaggle ore elsewhere?
sessionInfo()
is a stand-alone command.
You just submit it as is.
You should get a result that looks similar to this.
> SessionInfo()
R version 4.3.3 (2024-02-29)
Platform: x86_64-pc-linux-gnu (64-bit)
Running under: Ubuntu 22.04.4 LTS

Matrix products: default
BLAS:   /usr/lib/x86_64-linux-gnu/blas/libblas.so.3.10.0
LAPACK: /usr/lib/x86_64-linux-gnu/lapack/liblapack.so.3.10.0

locale:
 [1] LC_CTYPE=en_CA.UTF-8       LC_NUMERIC=C               LC_TIME=en_CA.UTF-8        LC_COLLATE=en_CA.UTF-8
 [5] LC_MONETARY=en_CA.UTF-8    LC_MESSAGES=en_CA.UTF-8    LC_PAPER=en_CA.UTF-8       LC_NAME=C
 [9] LC_ADDRESS=C               LC_TELEPHONE=C             LC_MEASUREMENT=en_CA.UTF-8 LC_IDENTIFICATION=C

time zone: America/New_York
tzcode source: system (glibc)

attached base packages:
[1] stats     graphics  grDevices utils     datasets  methods   base

loaded via a namespace (and not attached):
 [1] gtable_0.3.4      dplyr_1.1.4       compiler_4.3.3    Rcpp_1.0.12       rpart_4.1.23      tidyselect_1.2.1  htmlTable_2.4.2
 [8] clipr_0.8.0       stringr_1.5.1     gridExtra_2.3     cluster_2.1.6     Hmisc_5.1-2       scales_1.3.0      fastmap_1.1.1
[15] lobstr_1.1.2      ggplot2_3.5.0     R6_2.5.1          pak_0.7.2         generics_0.1.3    Formula_1.2-5     knitr_1.45
[22] htmlwidgets_1.6.4 backports_1.4.1   checkmate_2.3.1   tibble_3.2.1      munsell_0.5.1     nnet_7.3-19       pillar_1.9.0
[29] rlang_1.1.3       utf8_1.2.4        stringi_1.8.3     xfun_0.43         cli_3.6.2         formatR_1.14      magrittr_2.0.3
[36] digest_0.6.35     grid_4.3.3        rstudioapi_0.15.0 base64enc_0.1-3   lifecycle_1.0.4   pryr_0.1.6        vctrs_0.6.5
[43] data.table_1.15.4 evaluate_0.23     glue_1.7.0        codetools_0.2-19  fansi_1.0.6       colorspace_2.1-0  rmarkdown_2.26
[50] foreign_0.8-86    tools_4.3.3       pkgconfig_2.0.3   htmltools_0.5.8.1
>
Yes, its a google Capstone Project and no I didnt get all that you sent. thanks
I am honestly stuck and do not know how to proceed..
You will not get the same thing as I sent. I will have probably a different operating system as I am on Ubuntu Linux and I will have different packages installed. The output just should have the same format.
Okay, I think I've found the data and downloaded a month's worth. If so we need the rest of your code as the variables you supplied do not match the those in the dataset so I assume you have already done some data manipulation.
Thank you so much, but please would that stop any further crash? Thanks?
my apologies I just saw your response now. thanks so much for your help. I will revert now. Thanks
Alright I am back here again, and my sincere apologies, I am a student trying to learn as this is sincerely a different terrain for me.
okay, while I thought I had gotten past the crashing thing by doing the gc() function, I encountered another challenge trying to add "ride_length" calculation to all_trips (in seconds)" to my wrangling===
all_trips $ ride_length <-difftime(all_trips$ended_at,all_trips$started_at)
and this is what I keep getting ==== Error in as.POSIXlt.character(x, tz, ...) :
character string is not in a standard unambiguous format.
please how else am I supposed to write this code.
Thanks
I am a student trying to learn as this is sincerely a different terrain for me.
Not a problem, students are supposed to suffer. ![]() .
.
Besides, I have long held that R is beginner hostile.
Quite honestly, I cannot answer your question. We need to see what you have already done. It could be something as minor but annoying as a missing comma or a complete fiasco where you are riding off in all the wrong directions but without your code we don't know.
Please copy all your code and paste it here between
```
```
BTW, for formatting code rather than using === always use
```
```
It gives much better results.
alright then, but I thought I am only supposed to use this ``` when working on R markdown. I didnt know I can also use it on script.
#Library tidyverse
#library conflicted
library(conflicted)

# Setting dplyr::filter and dplyr::lag as the default choices
conflict_prefer("filter", "dplyr")
conflict_prefer("lag", "dplyr")

#importing data

q1_2019 <- read_csv("Divvy_Trips_2019_Q1.csv")
q1_2020 <- read_csv("Divvy_Trips_2020_Q1.csv")

#WRANGLE DATA AND COMBINE INTO A SINGLE FILE

colnames(q1_2019)
colnames(q1_2020)


#Renaming for consistencies

(q1_2019 <- rename(q1_2019
                   ,ride_id = trip_id
                   ,rideable_type = bikeid
                   ,started_at = start_time
                   ,ended_at = end_time
                   ,start_station_name = from_station_name
                   ,start_station_id = from_station_id
                   ,end_station_name = to_station_name
                   ,end_station_id = to_station_id
                   ,member_casual = usertype
                   ))


# Inspecting dataframes and look for incongruencies

str(q1_2019)
str(q1_2020)


# Convert ride_id and rideable_type to character so that they can stack correctly

q1_2019 <-  mutate(q1_2019, ride_id = as.character(ride_id)
                   ,rideable_type = as.character(rideable_type))
# Stack individual quarter's data frames into one big data frame


all_trips <- bind_rows(q1_2019, q1_2020)


# Remove lat, long, birthyear, and gender fields as this data was dropped beginning in 2020

all_trips <- all_trips %>%
  select(-c(start_lat, start_lng, end_lat, end_lng, birthyear, gender,  "tripduration"))

summary(all_trips)

table(all_trips$member_casual)


# Reassign to the desired values

all_trips <-  all_trips %>%
  mutate(member_casual = recode(member_casual
                                ,"Subscriber" = "member"
                                ,"Customer" = "casual"))

table(all_trips$member_casual)


# Add columns that list the date, month, day, and year of each ride
all_trips$date <- as.Date(all_trips$started_at)
all_trips$month <- format(as.Date(all_trips$date), "%m")
all_trips$day <- format(as.Date(all_trips$date), "%d")
all_trips$year <- format(as.Date(all_trips$date), "%Y")
all_trips$day_of_week <- format(as.Date(all_trips$date), "%A")


# Adding a "ride_length" calculation to all_trips (in seconds)

all_trips$ride_length <- difftime(all_trips$ended_at,all_trips$started_at)```The only thing I can see in the code you have provided is you have
#Library tidyverse
that makes no sense. Changed to
library(tidyverse)
and everything runs smoothly for me. Nicely formatted code and easy to read.
I really wonder what the challenge is from my end
So you still are having problems?
In that case we may have to look at RStudio settings, etc.
yes, I am still having challenges at this exact spot
i tried adding
and it went through but returned NA which is not possible and as such I cannot not aggregate.