Hi,
I would like to do some calculations which probably require a for loop. However, I am struggling as I have only basic knowledge in R.
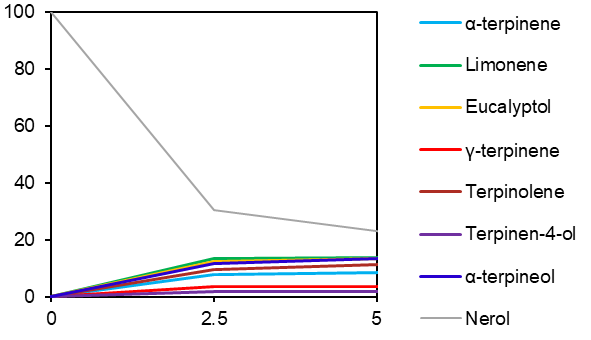
For the context, I am trying to generate a plot of yields as a function of time which I measured with gas chromatography. I have to normalize the Area values to get the “yield”.
Previously I was doing it with Excel. I have attached what it should look like for Sample 140A2. (notice the code gives the same result).

I only did the R code for the first three points (it goes from 0 to 30 with intervals of 2.5 in total) because it seem too tedious to do it that way. In the code below, I have removed the part where I import the data from a .csv, select the sample=140A2 and gather the df in a tidy format.
To be more efficient, I guess I should use something like ;
a2ij <- filter(filter(a2, Time==j), Compound=="i")[1,4]
Where i, the compound and j the time are increased with different intervals. But everything I tried so far does not work as I never used for loops... Some help would greatly be appreciated. I hope my explanation is cleat enough.
I am also open to any other comment on my code.
Thank you in advance
library(tidyr)
library(dplyr)
library(ggplot2)

#Making a datframe with the data (normaly read from a .csv)

Sample  <-c('140A2','140A2','140A2','140A2','140A2','140A2','140A2','140A2','140A2','140A2','140A2','140A2','140A2','140A2','140A2','140A2','140A2','140A2','140A2','140A2','140A2','140A2','140A2','140A2','140A2','140A2','140A2','140A2','140A2','140A2','140A2','140A2','140A2','140A2','140A2','140A2','140A2','140A2','140A2','140A2','140A2','140A2','140A2','140A2','140A2')
Time    <-c(0,10,2.5,5,7.5,0,10,2.5,5,7.5,0,10,2.5,5,7.5,0,10,2.5,5,7.5,0,10,2.5,5,7.5,0,10,2.5,5,7.5,0,10,2.5,5,7.5,0,10,2.5,5,7.5,0,10,2.5,5,7.5)
Compound<-c('decane','decane','decane','decane','decane','a.terpinene','a.terpinene','a.terpinene','a.terpinene','a.terpinene','limonene','limonene','limonene','limonene','limonene','eucalyptol','eucalyptol','eucalyptol','eucalyptol','eucalyptol','g.terpinene','g.terpinene','g.terpinene','g.terpinene','g.terpinene','terpinolene','terpinolene','terpinolene','terpinolene','terpinolene','terpinen.4.ol','terpinen.4.ol','terpinen.4.ol','terpinen.4.ol','terpinen.4.ol','a.terpineol','a.terpineol','a.terpineol','a.terpineol','a.terpineol','nerol','nerol','nerol','nerol','nerol')
Area    <-c(265.481,266.173,264.526,263.871,268.021,43.3003,140.866,126.685,134.157,139.129,33.9546,188.368,179.709,185.016,185.779,39.2046,201.155,52.2397,89.8097,91.8826,95.0269,93.4149,172.414,183.654,194.089,61.6955,204.255,61.7017,80.5377,81.8355,86.0851,83.6084,166.941,185.054,198.384,67.0067,229.565,194.27,213.8,229.658,1095.64,178.345,333.41,249.378,217.981)
a2 <-data.frame(Sample,Time,Compound,Area)

a210 <- filter(filter(a2, Time==0), Compound=="decane")[1,4]            #Select the area of compound 1 in a2 at Time=0
a220 <- filter(filter(a2, Time==0), Compound=="a.terpinene")[1,4]       #Select the area of compound 2 in a2 at Time=0
a230 <- filter(filter(a2, Time==0), Compound=="limonene")[1,4]          #Select the area of compound 3 in a2 at Time=0
a240 <- filter(filter(a2, Time==0), Compound=="eucalyptol")[1,4]        #and so on...
a250 <- filter(filter(a2, Time==0), Compound=="g.terpinene")[1,4]
a260 <- filter(filter(a2, Time==0), Compound=="terpinolene")[1,4]
a270 <- filter(filter(a2, Time==0), Compound=="terpinen.4.ol")[1,4]
a280 <- filter(filter(a2, Time==0), Compound=="a.terpineol")[1,4]
a290 <- filter(filter(a2, Time==0), Compound=="nerol")[1,4]

a212.5 <- filter(filter(a2, Time==2.5), Compound=="decane")[1,4]        #Select the area of compound 1 in a2 at Time=2.5
a222.5 <- filter(filter(a2, Time==2.5), Compound=="a.terpinene")[1,4]   #...
a232.5 <- filter(filter(a2, Time==2.5), Compound=="limonene")[1,4]
a242.5 <- filter(filter(a2, Time==2.5), Compound=="eucalyptol")[1,4]
a252.5 <- filter(filter(a2, Time==2.5), Compound=="g.terpinene")[1,4]
a262.5 <- filter(filter(a2, Time==2.5), Compound=="terpinolene")[1,4]
a272.5 <- filter(filter(a2, Time==2.5), Compound=="terpinen.4.ol")[1,4]
a282.5 <- filter(filter(a2, Time==2.5), Compound=="a.terpineol")[1,4]
a292.5 <- filter(filter(a2, Time==2.5), Compound=="nerol")[1,4]

a215 <- filter(filter(a2, Time==5), Compound=="decane")[1,4]            #Select the area of compound 1 in a2 at Time=5
a225 <- filter(filter(a2, Time==5), Compound=="a.terpinene")[1,4]       #...
a235 <- filter(filter(a2, Time==5), Compound=="limonene")[1,4]
a245 <- filter(filter(a2, Time==5), Compound=="eucalyptol")[1,4]
a255 <- filter(filter(a2, Time==5), Compound=="g.terpinene")[1,4]
a265 <- filter(filter(a2, Time==5), Compound=="terpinolene")[1,4]
a275 <- filter(filter(a2, Time==5), Compound=="terpinen.4.ol")[1,4]
a285 <- filter(filter(a2, Time==5), Compound=="a.terpineol")[1,4]
a295 <- filter(filter(a2, Time==5), Compound=="nerol")[1,4]

#ratio of compound 9 over compound 1 at Time=0 used in all further calculations
a200 <-(a290/a210)

#Calculating the yields at Time=0
a220 <-(a220/a210)/a200
a230 <-(a230/a210)/a200
a240 <-(a240/a210)/a200
a250 <-(a250/a210)/a200
a260 <-(a260/a210)/a200
a270 <-(a270/a210)/a200
a280 <-(a280/a210)/a200
a290 <-(a290/a210)/a200

#Making vector of all yields at Time=0 and subtract the value at Time=0
a2x0 <-c(a220-a220,a230-a230,a240-a240,a250-a250,a260-a260,a270-a270,a280-a280,a290)

#Calculating the yields at Time=2.5
a222.5 <-(a222.5/a212.5)/a200
a232.5 <-(a232.5/a212.5)/a200
a242.5 <-(a242.5/a212.5)/a200
a252.5 <-(a252.5/a212.5)/a200
a262.5 <-(a262.5/a212.5)/a200
a272.5 <-(a272.5/a212.5)/a200
a282.5 <-(a282.5/a212.5)/a200
a292.5 <-(a292.5/a212.5)/a200

#Making vector of all yields at Time=2.5 and subtract the value at Time=0
a2x2.5 <-c(a222.5-a220,a232.5-a230,a242.5-a240,a252.5-a250,a262.5-a260,a272.5-a270,a282.5-a280,a292.5)

#Calculating the yields at Time=5
a225 <-(a225/a215)/a200
a235 <-(a235/a215)/a200
a245 <-(a245/a215)/a200
a255 <-(a255/a215)/a200
a265 <-(a265/a215)/a200
a275 <-(a275/a215)/a200
a285 <-(a285/a215)/a200
a295 <-(a295/a215)/a200

#Making vector of all yields at Time=5 and subtract the value at Time=0
a2x5 <-c(a225-a220,a235-a230,a245-a240,a255-a250,a265-a260,a275-a270,a285-a280,a295)

#Making vector of all Compounds
Compound<-c("a.terpinene","limonene","eucalyptol","g.terpinene","terpinolene","terpinen.4.ol","a.terpineol","nerol")

#Assembling the vectors in a dataframe and tidying them with "gather", extract the time from the column name with "separate",
#and multiply the yield by 100 to get %
df <-data.frame(Compound,a2x0,a2x2.5,a2x5)
df2<-gather(df,"Time","Yield",2:4)
df3<-separate(df2, "Time",c("Sample", "Time"), "x")
df4<-mutate_at(df3,"Yield",.funs = funs(.*100))
df4$Time = as.double(df4$Time)

#Plot the yields as a function of time
ggplot(df4, aes(x=Time, y=Yield, group=Compound)) + geom_line()