Hi,
Crossposting from stackoverflow.
I have some data ( design.df below) which I want to explore with an R shiny app:
set.seed(1)
library(dplyr)
samples <- paste0("s",1:5)
clusters <- paste0("c",1:10)
groups <- paste0("g",1:20)

design.df <- expand.grid(samples,clusters,groups) %>%
    dplyr::rename(sample=Var1,cluster=Var2,group=Var3) %>%
    dplyr::mutate(value=rnorm(nrow(.)))
I want to allow the user to be able to subset the design.df by any of the columns (leave the value column). In this example, these will be sample , cluster , and group , but in reality, this is an app to which different users will load data.frame s with different columns (leave the value column which all will have).
I'm trying to adapt the 10.3.2 Dynamic filtering example to my case but not quite there.
Here's my code:
library(shiny)
library(dplyr)

make_ui <- function(x, var) {
  if (is.numeric(x)) {
    rng <- range(x, na.rm = TRUE)
    sliderInput(var, var, min = rng[1], max = rng[2], value = rng)
  } else if (is.factor(x)) {
    levs <- levels(x)
    selectInput(var, var, choices = levs, selected = levs, multiple = TRUE)
  } else {
    # Not supported
    NULL
  }
}

filter_var <- function(x, val) {
  if (is.numeric(x)) {
    !is.na(x) & x >= val[1] & x <= val[2]
  } else if (is.factor(x)) {
    x %in% val
  } else {
    # No control, so don't filter
    TRUE
  }
}

server <- function(input, output)
{
  data <- reactive({
    get(input$dataset, data.frame(dplyr::select(design.df,-value)))
  })

  vars <- reactive(names(data()))

  output$filter <- renderUI(
    purrr::map(vars, ~ make_ui(data()[[.x]], .x))
  )

  selected <- reactive({
    each_var <- purrr::map(vars, ~ filter_var(data()[[.x]], input[[.x]]))
    purrr::reduce(each_var, `&`)
  })

  scatter.plot <- reactive({
    scatter.plot <- NULL
    if(!is.null(data()[selected(),]){
      plot.df <- suppressWarnings(data()[selected(), ])
      scatter.plot <- suppressWarnings(plotly::plot_ly(marker=list(size=3),type='scatter',mode="markers",color=plot.df$sample,x=plot.df$group,y=plot.df$value) %>%
                                         plotly::layout(xaxis=list(title="group",showgrid=F),yaxis=list(title="value",showgrid=F)))
    }
    return(scatter.plot)
  })

  output$out.plot <- plotly::renderPlotly({
    scatter.plot()
  })
}

ui <- fluidPage(
  titlePanel("Data Explorer"),
  sidebarLayout(
    sidebarPanel(
      tags$head(
        tags$style(HTML(".multicol {-webkit-column-count: 3; /* Chrome, Safari, Opera */-moz-column-count: 3; /* Firefox */column-count: 3;}")),
        tags$style(type="text/css", "#loadmessage {position: fixed;top: 0px;left: 0px;width: 100%;padding: 5px 0px 5px 0px;text-align: center;font-weight: bold;font-size: 100%;color: #000000;background-color: #CCFF66;z-index: 105;}"),
        tags$style(type="text/css",".shiny-output-error { visibility: hidden; }",".shiny-output-error:before { visibility: hidden; }")),
      conditionalPanel(condition="$('html').hasClass('shiny-busy')",tags$div("In Progress...",id="loadmessage")),
      selectInput("dataset", label = "Dataset", choices = colnames(dplyr::select(design.df,-value))),
      uiOutput("filter"),
    ),
    mainPanel(
      plotly::plotlyOutput("out.plot")
    )
  )
)

shinyApp(ui = ui, server = server)
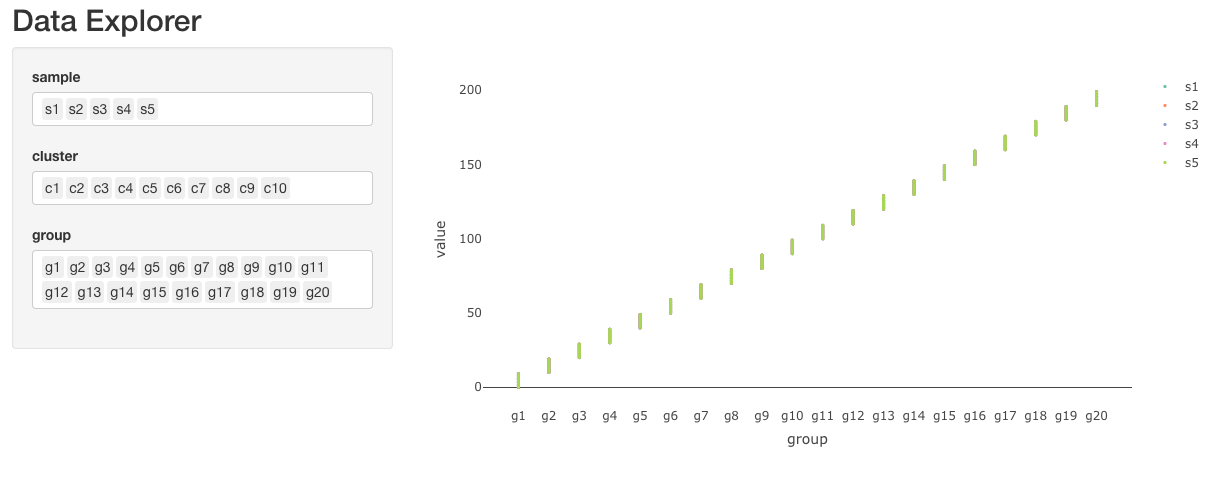
Which gives this interface:
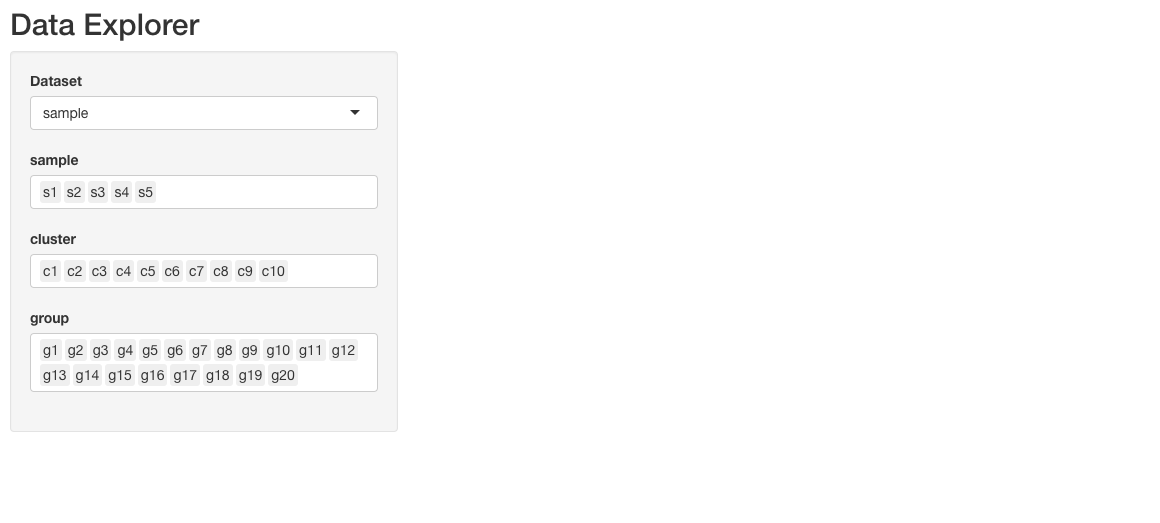
It is close to what I want but still has a few issues:
- It presents all columns of design.df rather than reacting to the selected one.
- It is not displaying the scatter plot, probably because of the condition that I set up in the
scatter.plotreactive.
Any idea what's wrong?
Once these are solved I'll also need to update the plotting code in the scatter.plot reactive so that it does not explicitly choose column names from design.df but rather selected ones, but that's not critical at all for this post.