Hi, your date column wasn't in a date format. You also had shijian in scale_x_date(), which didn't need to be there.
See the edited dataset here.
library(tidyverse)
library(scales)
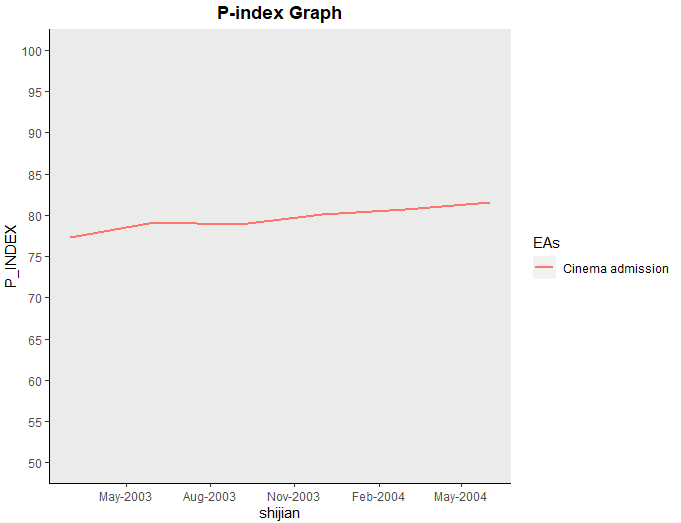
V3 <- tibble::tribble(
~EAs, ~P_INDEX, ~shijian,
"Cinema admission", 77.3, 200303L,
"Cinema admission", 79.1, 200306L,
"Cinema admission", 78.9, 200309L,
"Cinema admission", 80.1, 200312L,
"Cinema admission", 80.7, 200403L,
"Cinema admission", 81.6, 200406L
) %>%
mutate(shijian = as.Date(paste0(as.character(shijian), "01"), format = "%Y%m%d"))
ggplot(V3, aes(shijian, P_INDEX, colour = EAs)) +
geom_line(size=0.8) +
scale_x_date(date_breaks = '3 months',
date_labels = '%b-%Y') +
scale_y_continuous(limits = c(50,100), breaks = scales::breaks_width(5)) +
theme (plot.title = element_text(hjust = 0.5, face= 'bold'),
plot.background = element_rect(fill = 'white'),
panel.grid.major = element_blank(),
panel.grid.minor = element_blank(),
panel.border = element_blank(),
axis.line.x = element_line(color = 'black'),
axis.line.y = element_line(color = 'black')) +
labs(title = 'P-index Graph')
Next time please provide a reproducible dataset