Hi forks,
I am trying to label my x axis, but I keep encountering errors.
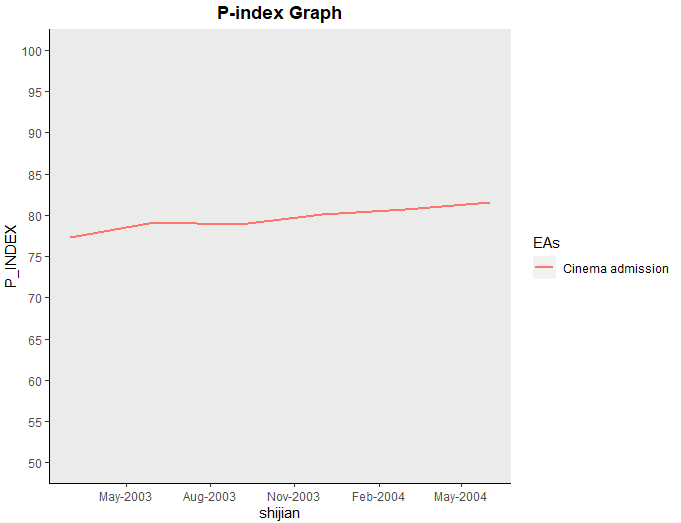
Goal to achieve: transform 200303 to Mar 2003 with 6 months/1 year interval on my x axis.
This is the error I got in my R.
V3 %>%
- ggplot(aes(shijian, P_INDEX, colour = EAs)) +
- geom_line(size=0.8)+
- scale_x_date(shijian, date_breaks = '1 year'
-
date_labels = '%b-%Y')+
Error: unexpected symbol in:
" scale_x_date(shijian, date_breaks = '1 year'
** date_labels"**
scale_y_continuous(limits = c(100,150), breaks = scales::breaks_width(5))+
- theme (plot.title = element_text(hjust = 0.5, face= 'bold'),
-
plot.background = element_rect(fill = 'white'), -
panel.grid.major = element_blank(), -
panel.grid.minor = element_blank(), -
panel.border = element_blank(), -
axis.line.x = element_line(color = 'black'), -
axis.line.y = element_line(color = 'black'))+ - ggtitle(label = 'P-index Graph')
Error: Cannot add ggproto objects together. Did you forget to add this object to a ggplot object?
Runrlang::last_error()to see where the error occurred.
head(V3)
A tibble: 6 x 3
EAs P_INDEX shijian
1 Cinema admission 77.3 200303
2 Cinema admission 79.1 200306
3 Cinema admission 78.9 200309
4 Cinema admission 80.1 200312
5 Cinema admission 80.7 200403
6 Cinema admission 81.6 200406
First time posting a question, if my format is hard to read, sorry in advance.
Thank you very much, guys.