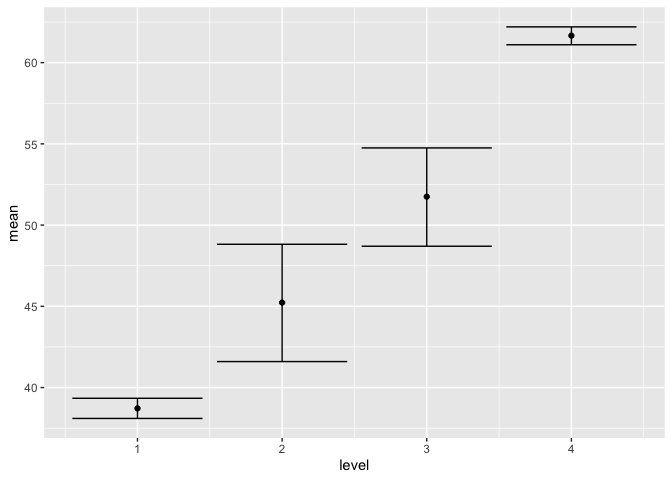
After a decade away from R, I'm struggling to debug this code. I'm trying to use summary data to create a plot of means and confidence intervals. Here's the data frame:
plotData
' ' ' r#This works without errors
print(image)
#This gives me the error message "Mapping should be created with aes() or aes_()."
I've tried it with and without the "mapping =" and I get the same error. Any ideas how I can fix this?
Hi @rachelriskind ,
There were two issues with the code:
You were missing a closed parenthesis for the ggplot() function. The geom_* get added to a ggplot() call, they aren't nested inside the call
# Pseudo-code
ggplot() +
  geom_*()

# Not
ggplot(geom_*())
The + need to be on the same line as the the function calls.
The below code works...
library(tidyverse)

plotData <-
  tribble(
    ~level, ~mean, ~cil, ~ciu,
    1, 38.72, 38.1, 39.34,
    2, 45.23, 41.6, 48.82,
    3, 51.75, 48.7, 54.75,
    4, 61.66, 61.1, 62.20
  )
plotData
#> # A tibble: 4 x 4
#>   level  mean   cil   ciu
#>   <dbl> <dbl> <dbl> <dbl>
#> 1     1  38.7  38.1  39.3
#> 2     2  45.2  41.6  48.8
#> 3     3  51.8  48.7  54.8
#> 4     4  61.7  61.1  62.2

image<-ggplot(plotData,
              aes(
                x=level,
                y=mean
              )) +
                geom_errorbar(mapping = aes(
                  x=level,
                  ymin=cil,
                  ymax=ciu
                )
                ) +
                geom_point(mapping = aes(
                  x=level,
                  y=mean
                )
                )
image
# Cleaner version of the code to see things more clearly
plotData %>%
  ggplot() +
  geom_point(aes(x = level, y = mean)) +
  geom_errorbar(aes(x = level, ymin = cil, ymax = ciu))
Created on 2020-10-12 by the reprex package (v0.3.0)
1 Like
Thank you so much for the helpful and speedy response! Much appreciated.
1 Like
system
November 3, 2020, 1:18pm
4
This topic was automatically closed 21 days after the last reply. New replies are no longer allowed.