This doesn't work in my system.
sessionInfo
> sessionInfo()
R version 3.6.1 (2019-07-05)
Platform: x86_64-w64-mingw32/x64 (64-bit)
Running under: Windows 10 x64 (build 18362)

Matrix products: default

locale:
[1] LC_COLLATE=English_India.1252  LC_CTYPE=English_India.1252
[3] LC_MONETARY=English_India.1252 LC_NUMERIC=C
[5] LC_TIME=English_India.1252

attached base packages:
[1] stats     graphics  grDevices utils     datasets  methods
[7] base

loaded via a namespace (and not attached):
[1] compiler_3.6.1 tools_3.6.1
This happens because as.integer just truncates the fractional part, and for the particular seed value of 15, one value of a (the 4th one) becomes 0. Since indexing starts from 1 in R, it doesn't return anything and hence the length varies in between x[a] and y[b].
I think this works in Fer's system because of the old version. The algorithm of random number generation changed in a recent update, though I haven't noted carefully which are the functions are affected by that change (I thought only sample, but apparently that's not the case).
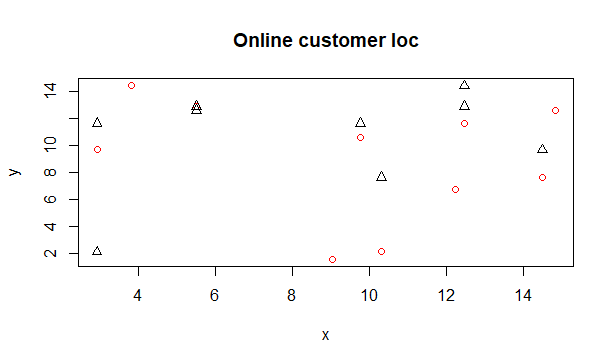
@Emmadadil, I didn't really follow what you mean. If you just want to plot the original points in "red", and some random points from the cartesian product of the co-ordinates, you can do something like this:
set.seed(seed = 15)

x <- runif(n = 10,
           min = 0,
           max = 15)
y <- runif(n = 10,
           min = 0,
           max = 15)

plot(x = x,
     y = y,
     main = "Online customer loc",
     col = "red")
points(x = sample(x = x,
                  size = 10,
                  replace = TRUE),
       y = sample(x = y,
                  size = 10,
                  replace = TRUE),
       pch = 2)
This generates the following plot:
Please customise the plot as per your requirement.
Hope this helps.