Hello everyone, I'm trying to run a Tukey's HSD test, and following several examples online, this keeps giving me error.
ERROR: Error: Aesthetics must be either length 1 or the same as the data (15): x, label
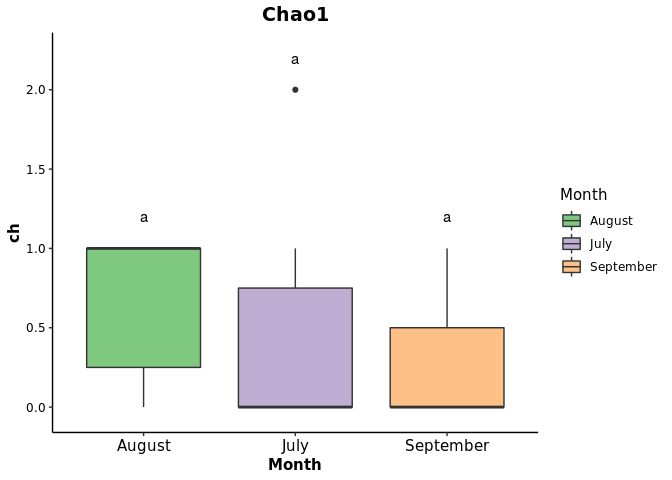
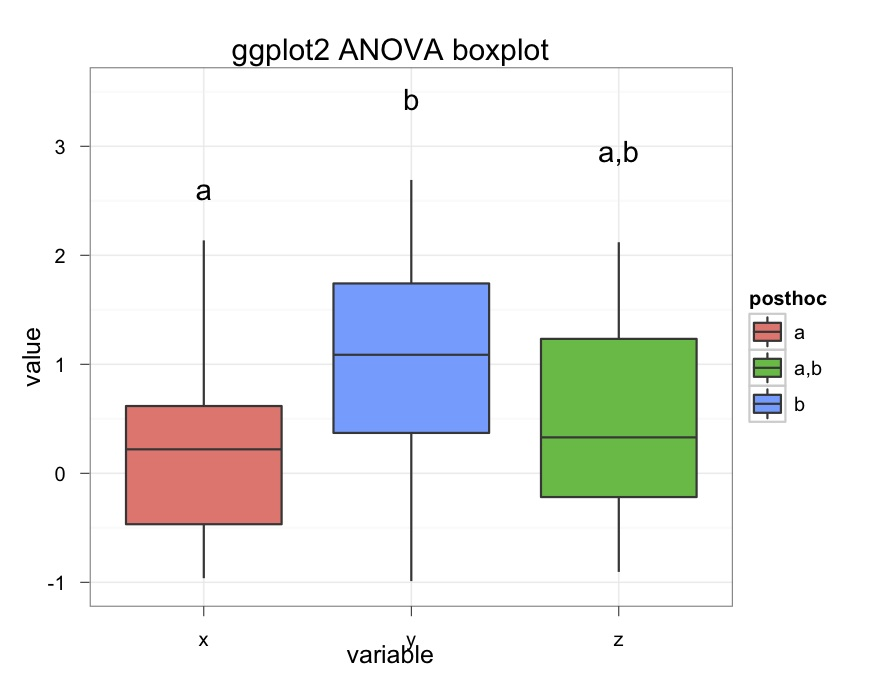
I'm trying to get something like this:
This is my script:
library(vegan)
#> Loading required package: permute
#> Loading required package: lattice
#> This is vegan 2.5-5
library(readxl)
library(multcompView)
library(plyr)
#rarefy con la media de reads por muestra https://www.ncbi.nlm.nih.gov/pmc/articles/PMC3233110/
familia<- read_excel("~/RSTUDIO/Datos_cianobacterias/cianobacterias_reprex.xlsx")
#columna con las muestrasias
data <- familia
replicates <- as.data.frame(colnames(data)[-1])
colnames(replicates) <- "replicates"
attach(familia)
rwnames <- index
data <- as.matrix(data[,-1])
estimateR(data)
#> [,1] [,2] [,3] [,4] [,5] [,6] [,7] [,8] [,9] [,10] [,11] [,12]
#> S.obs 0 1 0 1 0 1 0 0 2 0 0 1
#> S.chao1 0 1 0 1 0 1 0 0 2 0 0 1
#> se.chao1 NaN 0 NaN 0 NaN 0 NaN NaN 0 NaN NaN 0
#> S.ACE NaN 1 NaN NaN NaN NaN NaN NaN NaN NaN NaN NaN
#> se.ACE NaN 0 NaN NaN NaN NaN NaN NaN NaN NaN NaN NaN
#> [,13] [,14] [,15]
#> S.obs 1 0 1
#> S.chao1 1 0 1
#> se.chao1 0 NaN 0
#> S.ACE NaN NaN 1
#> se.ACE NaN NaN 0
ch <- estimateR(data)
ch=estimateR(data)[2,]
write.csv(ch, file = "~/RSTUDIO/Datos_cianobacterias/ch-estimater-familia.csv")
#boxplot
#agregar el Tx= Control MS o T2DM
bpdata <- read.csv("~/RSTUDIO/Datos_cianobacterias/metadata_reprex.csv", row.names=1)
attach(bpdata)
bpdata <- data.frame(Month=Month, ch=ch)
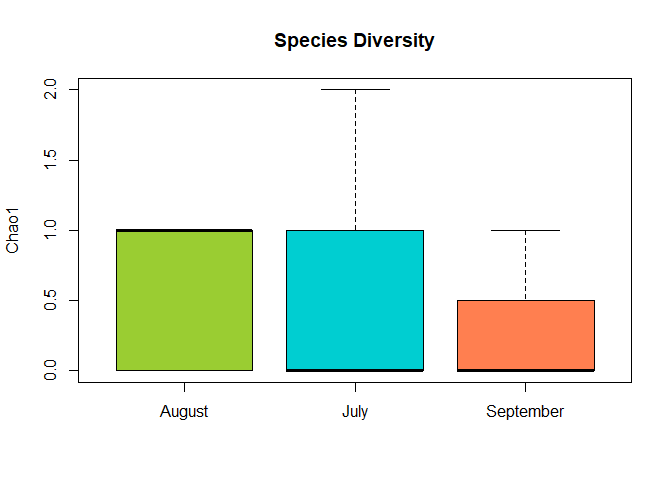
colvec<- c("yellowgreen","darkturquoise", "coral")
boxplot(ch~Month, bpdata, col = colvec, ylab = "Chao1", main = "Species Diversity")
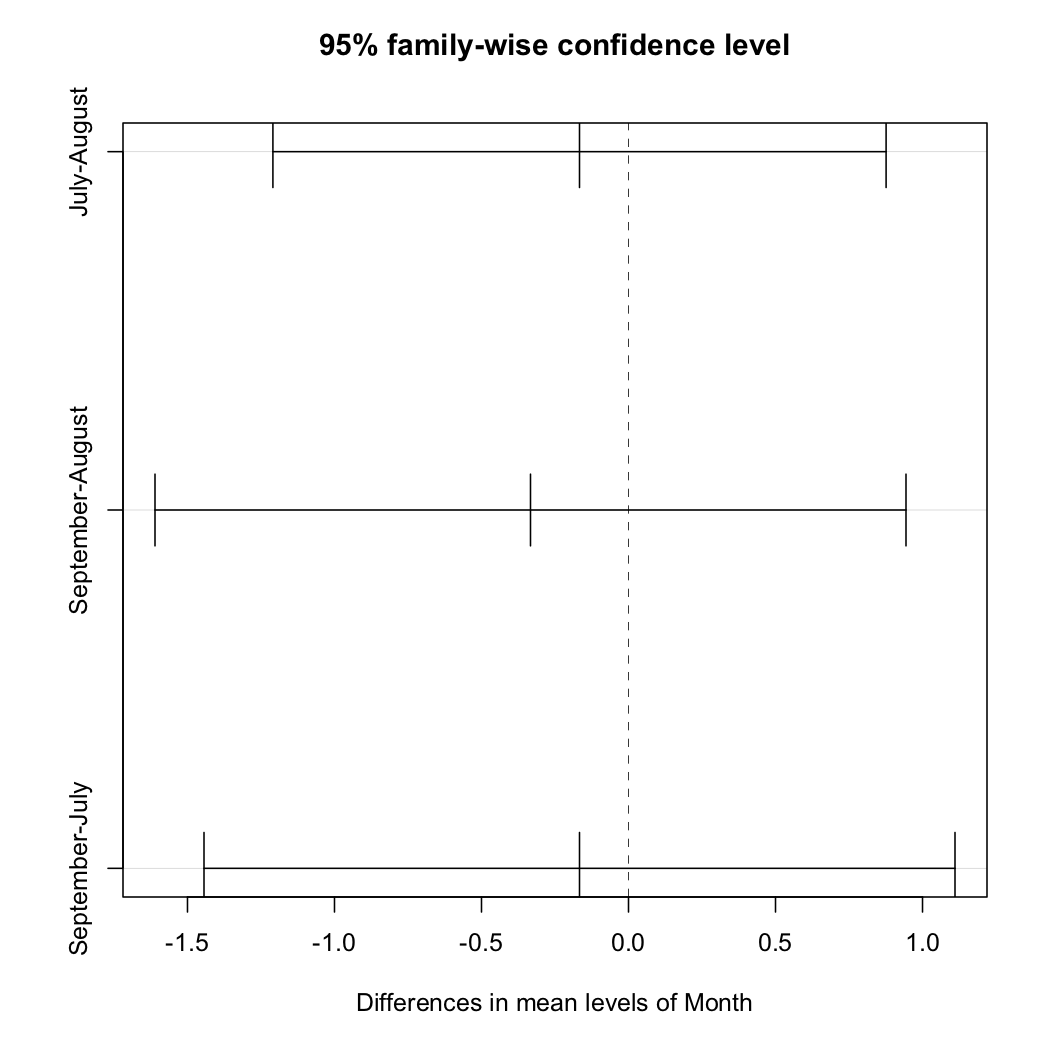
a <- aov(ch~Month, data=bpdata)
tHSD <- TukeyHSD(a, ordered = FALSE, conf.level = 0.95)


generate_label_df <- function(HSD, flev){
#Extract labels and factor levels from Tukey post-hoc
Tukey.levels <- HSD[[flev]][,4]
Tukey.labels <- multcompLetters(Tukey.levels)['Letters']
plot.labels <- names(Tukey.labels[['Letters']])

# Get highest quantile for Tukey's 5 number summary and add a bit of space to buffer between
# upper quantile and label placement
boxplot.df <- ddply(bpdata, flev, function (x) max(fivenum(x$y)) + 0.2)

# Create a data frame out of the factor levels and Tukey's homogenous group letters
plot.levels <- data.frame(plot.labels, labels = Tukey.labels[['Letters']],
                          stringsAsFactors = FALSE)

# Merge it with the labels
labels.df <- merge(plot.levels, boxplot.df, by.x = 'plot.labels', by.y = flev, sort = FALSE)

return(labels.df)
}

bpdata$Month <- factor(bpdata$Month,
                      labels = c("Jul", "Aug", "Sep"))

tumeans <- aggregate(ch ~ Month, bpdata, mean)
library(ggplot2)
#library(ggsignif)
library(tidyverse)

bxplot <- ggplot(bpdata, aes(x=Month, y = ch, fill =Month )) + geom_boxplot ()+
  geom_text(data =generate_label_df(tHSD,'Month'), aes(x = plot.labels, y = ch, label = labels))+
  scale_y_continuous(expand = c(0.05,0.05))+
  ggtitle("Chao1")+
  theme_bw() +
  theme(panel.grid.major = element_line(colour = "white"),
        panel.grid.minor = element_blank(),
        panel.border = element_blank(),
        panel.background = element_blank(),
        plot.title = element_text(hjust = 0.5, size = 14, family = "Tahoma", face = "bold"),
        text=element_text(family = "Tahoma"),
        axis.title = element_text(face="bold"),
        axis.text.x = element_text(colour="black", size = 11),
        axis.text.y = element_text(colour="black", size = 9),
        axis.line = element_line(size=0.5, colour = "black"))
scale_fill_brewer(palette = "Accent")
#> <ggproto object: Class ScaleDiscrete, Scale, gg>
#>     aesthetics: fill
#>     axis_order: function
#>     break_info: function
#>     break_positions: function
#>     breaks: waiver
#>     call: call
#>     clone: function
#>     dimension: function
#>     drop: TRUE
#>     expand: waiver
#>     get_breaks: function
#>     get_breaks_minor: function
#>     get_labels: function
#>     get_limits: function
#>     guide: legend
#>     is_discrete: function
#>     is_empty: function
#>     labels: waiver
#>     limits: NULL
#>     make_sec_title: function
#>     make_title: function
#>     map: function
#>     map_df: function
#>     n.breaks.cache: NULL
#>     na.translate: TRUE
#>     na.value: NA
#>     name: waiver
#>     palette: function
#>     palette.cache: NULL
#>     position: left
#>     range: <ggproto object: Class RangeDiscrete, Range, gg>
#>         range: NULL
#>         reset: function
#>         train: function
#>         super:  <ggproto object: Class RangeDiscrete, Range, gg>
#>     reset: function
#>     scale_name: brewer
#>     train: function
#>     train_df: function
#>     transform: function
#>     transform_df: function
#>     super:  <ggproto object: Class ScaleDiscrete, Scale, gg>
bxplot
#> Error: Aesthetics must be either length 1 or the same as the data (15): x, label

Created on 2019-10-24 by the reprex package (v0.3.0)
This is familia:
familia <- data.frame(stringsAsFactors=FALSE,
                               index = c("1A", "1B", "1C", "1D", "1E", "1F", "1G", "1H",
                                         "2A", "2B", "2C", "2D", "2E", "2F",
                                         "2G"),
               Un.Caenarcaniphilales = c(0, 0, 0, 0, 0, 0, 0, 0, 0, 0, 0, 0, 0, 0, 0),
              Un.Gastranaerophilales = c(0, 2, 0, 0, 0, 27, 0, 0, 22, 0, 0, 41, 0, 0, 9),
                Un.Obscuribacterales = c(0, 0, 0, 0, 0, 0, 0, 0, 0, 0, 0, 0, 0, 0, 0),
               Un.Vampirovibrionales = c(0, 0, 0, 300, 0, 0, 0, 0, 221, 0, 0, 0, 282, 0, 0)
           )
Created on 2019-10-24 by the reprex package (v0.3.0)
This is bpdata:
bpdata <- data.frame(stringsAsFactors=FALSE,
              SampleID = c("1A", "1B", "1C", "1D", "1E", "1F", "1G", "1H", "2A", "2B",
                           "2C", "2D", "2E", "2F", "2G"),
                 Month = c("July", "July", "July", "August", "August", "August",
                           "September", "September", "July", "July", "July",
                           "August", "August", "August", "September")
          )
Created on 2019-10-24 by the reprex package (v0.3.0)