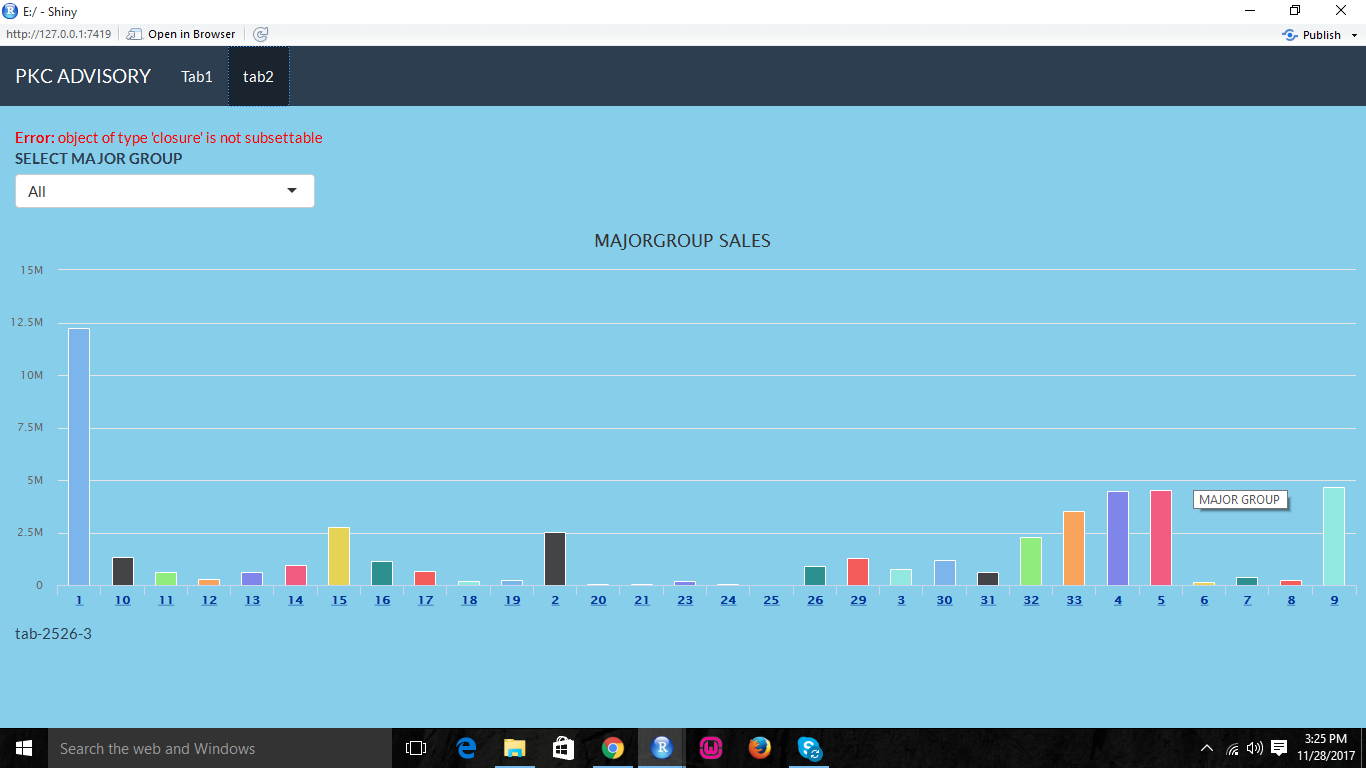
I'm getting the correct output. but this following error "object of type 'closure' is not subsettable" occurs repeatedly.. How to get recover from it? Thank You:)
It is hard to help without more information. If you can create a minimal reprex and/or provide a bit more detail about when the error is thrown relative to the output that you receive / expect, that would be very helpful!
In any case, my best guess is that you may be dealing with either:
- Reactives that are not being called properly (A reactive must always be called with
reactiveName()instead of justreactiveName). If you try something likereactiveName[1:4], it will complain that you are trying to "subset a function," which makes no sense. The solution would bereactiveName()[1:4]. - Accessing the value of a reactive before the reactive is ready. In this case
shiny::req()can be a very helpful function to protect your app from the temporary errors that happen during app initialization, etc.
1 Like
i have not used reactive() in my code.. here with i have attached my coding
output$content1 <- renderUI({
  output$BRANCH<-renderHighchart({
    data1<-dbGetQuery(conn,"SELECT DISTINCT VBRNCH AS BRANCH, VMAJGR AS MAJOR,SUM(VNETIV) AS SALES FROM invcpf GROUP BY VBRNCH,VMAJGR")
    new<-dbGetQuery(conn,"SELECT DISTINCT VBRNCH,SUM(VNETIV) AS SALES FROM invcpf GROUP BY VBRNCH")

    if (input$branc == "All") {
      bran<-data_frame(name=new$VBRNCH,
                       y=new$SALES,
                       drilldown=tolower(name))
      second_el_to_numeric <- function(ls){
        map(ls, function(x){
          x[[2]] <- as.numeric(x[[2]])
          x
        })
      }
      hc <- highchart() %>%
        hc_chart(type = "column") %>%
        hc_title(text = "BRANCH SALES") %>%
        hc_xAxis(type = "category") %>%
        hc_legend(enabled = FALSE) %>%
        hc_add_series(
          name = "VNETIV",
          colorByPoint = TRUE,
          data = bran
        )
      hc
    }
    else
    {
      data1 <- data1[data1$BRANCH == input$branc,]
      bran<-data_frame(name=data1$MAJOR,
                       y=data1$SALES,
                       drilldown=tolower(name))
      second_el_to_numeric <- function(ls){
        map(ls, function(x){
          x[[2]] <- as.numeric(x[[2]])
          x
        })
      }
      hc <- highchart() %>%
        hc_chart(type = "column") %>%
        hc_title(text = "MAJORGROUP SALES") %>%
        hc_xAxis(type = "category") %>%
        hc_legend(enabled = FALSE) %>%
        hc_add_series(
          name = "VNETIV",
          colorByPoint = TRUE,
          data = bran
        )
      hc
    }
  })
})
A few things:
- It seems to me that you are still missing a component of the application? The UI / server functions, where the inputs are coming from, etc.
- You might have a look at this article on debugging shiny applications. It should be possible to narrow your scope a little bit by looking at logging / traceback / breakpoints / etc.
- I notice you have used
lsas a parameter in your function. This may be part of your problem,base::ls()is a function, and it is best to avoid base function names in your variable declarations (i.e. if you are passingbase::ls()intomap, that may be the cause of your trouble) - It does not look like
second_el_to_numericis ever called, either, though.
I do not feel like I have a good sense for what you are doing, and there is definitely a lot of difficulty in assisting without a reprex that I can run locally (see link/article in my last post). The idea behind a reprex is to make it easier for others to help you by handing them minimally reproducible code that they can run in their environment.
I am on cellphone so cannot test however to me it seems that error will be triggered by part where you create dataframe. You define name as data$Major and then drilldown as tolower(name). However at this point the name column doesnt exist yet since you are creating table only. R therefore looks for "name" object in parent environment and i guess it finds some function called name. Thus it tries to run tolower on funcion object which errors. Create dataframe without name column and then add it in a nexr call and let us know if it worked