Hello All,
I am trying my hands at making shiny widgets in Rmarkdown documents . I encountered a problem while creating a widget that allows user to choose x and y variables of a data and plots the results. However, generated output chart is incorrect. This generated chart has no axis and the data is represented in incorrect pattern. I am following Shiny - Introduction to interactive documents as a reference.
I usually post with a reprex but while creating one for this it generated the error - Error: callr subprocess failed: Functions that produce HTML output found in document targeting markdown_strict output. Hence requesting you to look at the code below.
title: "Your Document Title"
author: "Document Author"
date: "r Sys.Date()"
output:
prettydoc::html_pretty:
theme: cayman
highlight: github
runtime: shiny
knitr::opts_chunk$set(echo = TRUE)
library(tidyverse)
library(shiny)
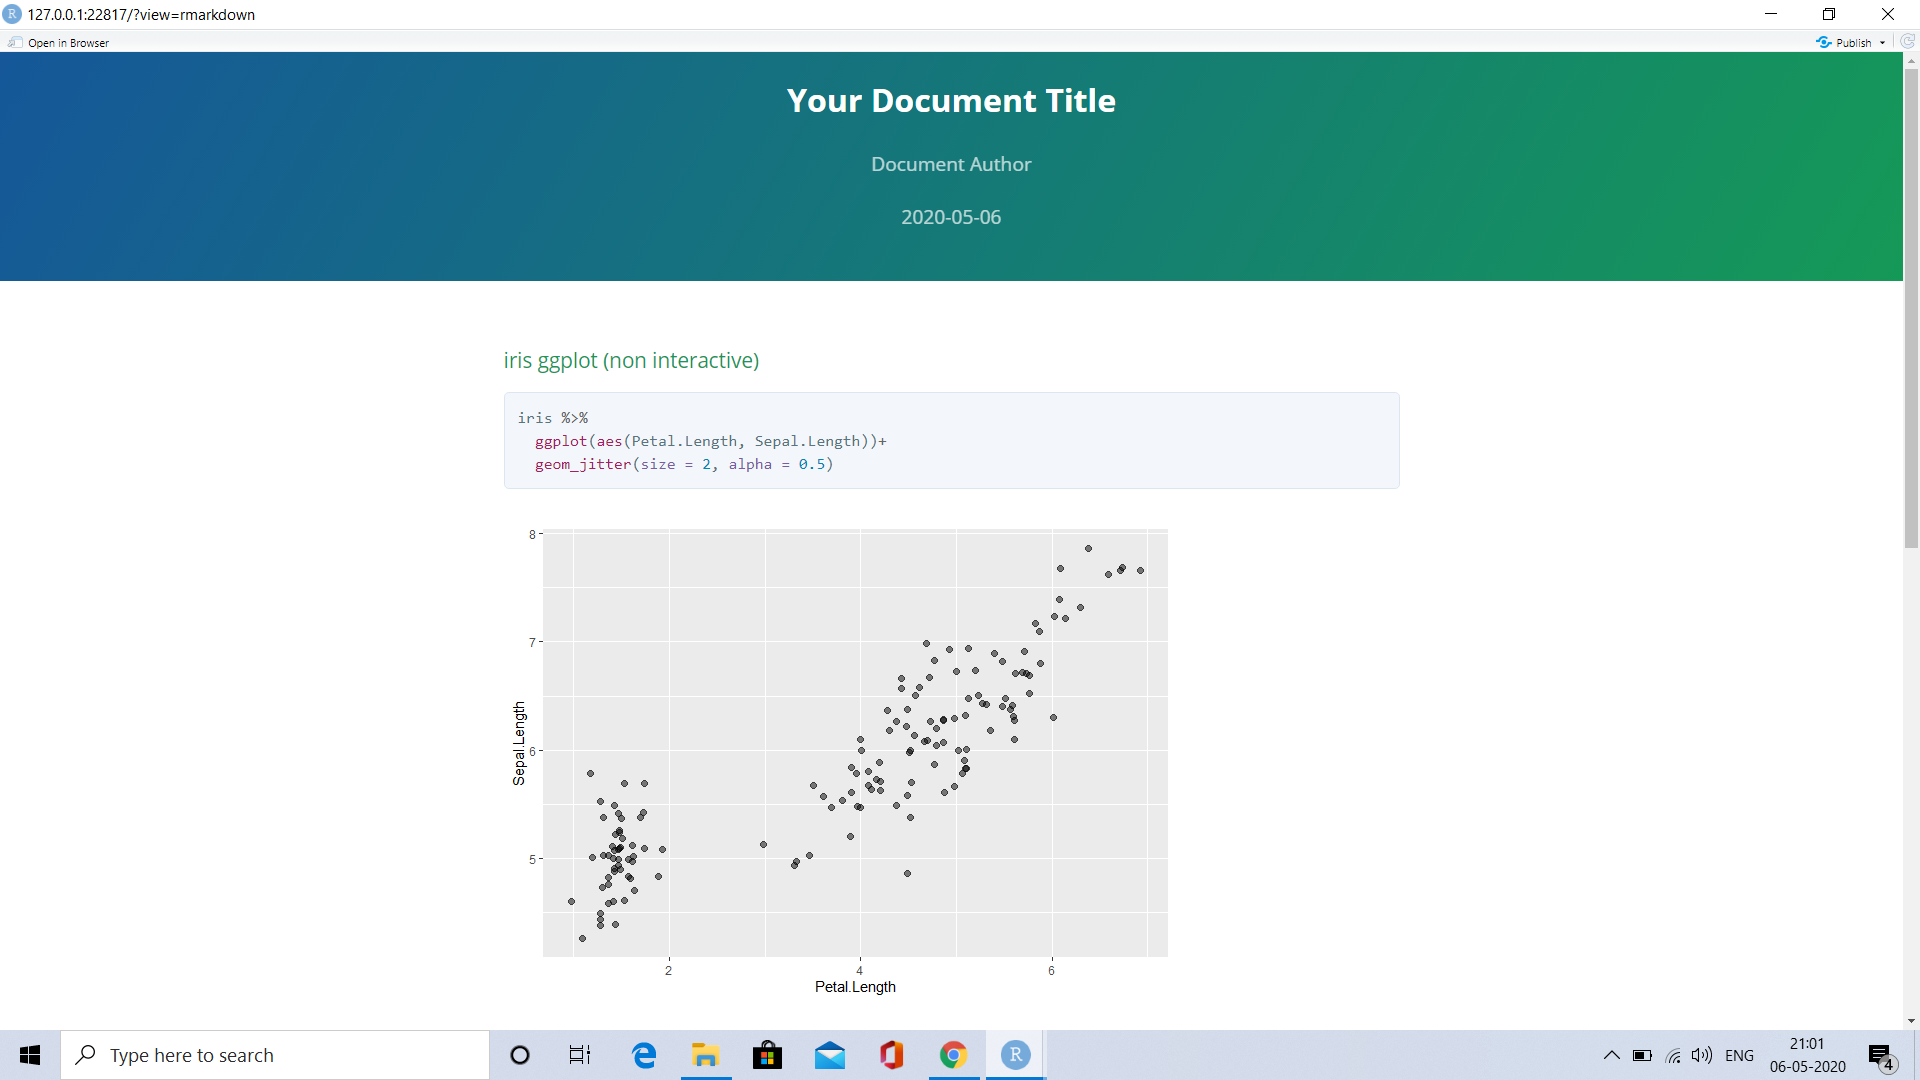
iris ggplot (non interactive)
iris %>%
  ggplot(aes(Petal.Length, Sepal.Length))+
  geom_jitter(size = 2, alpha = 0.5)
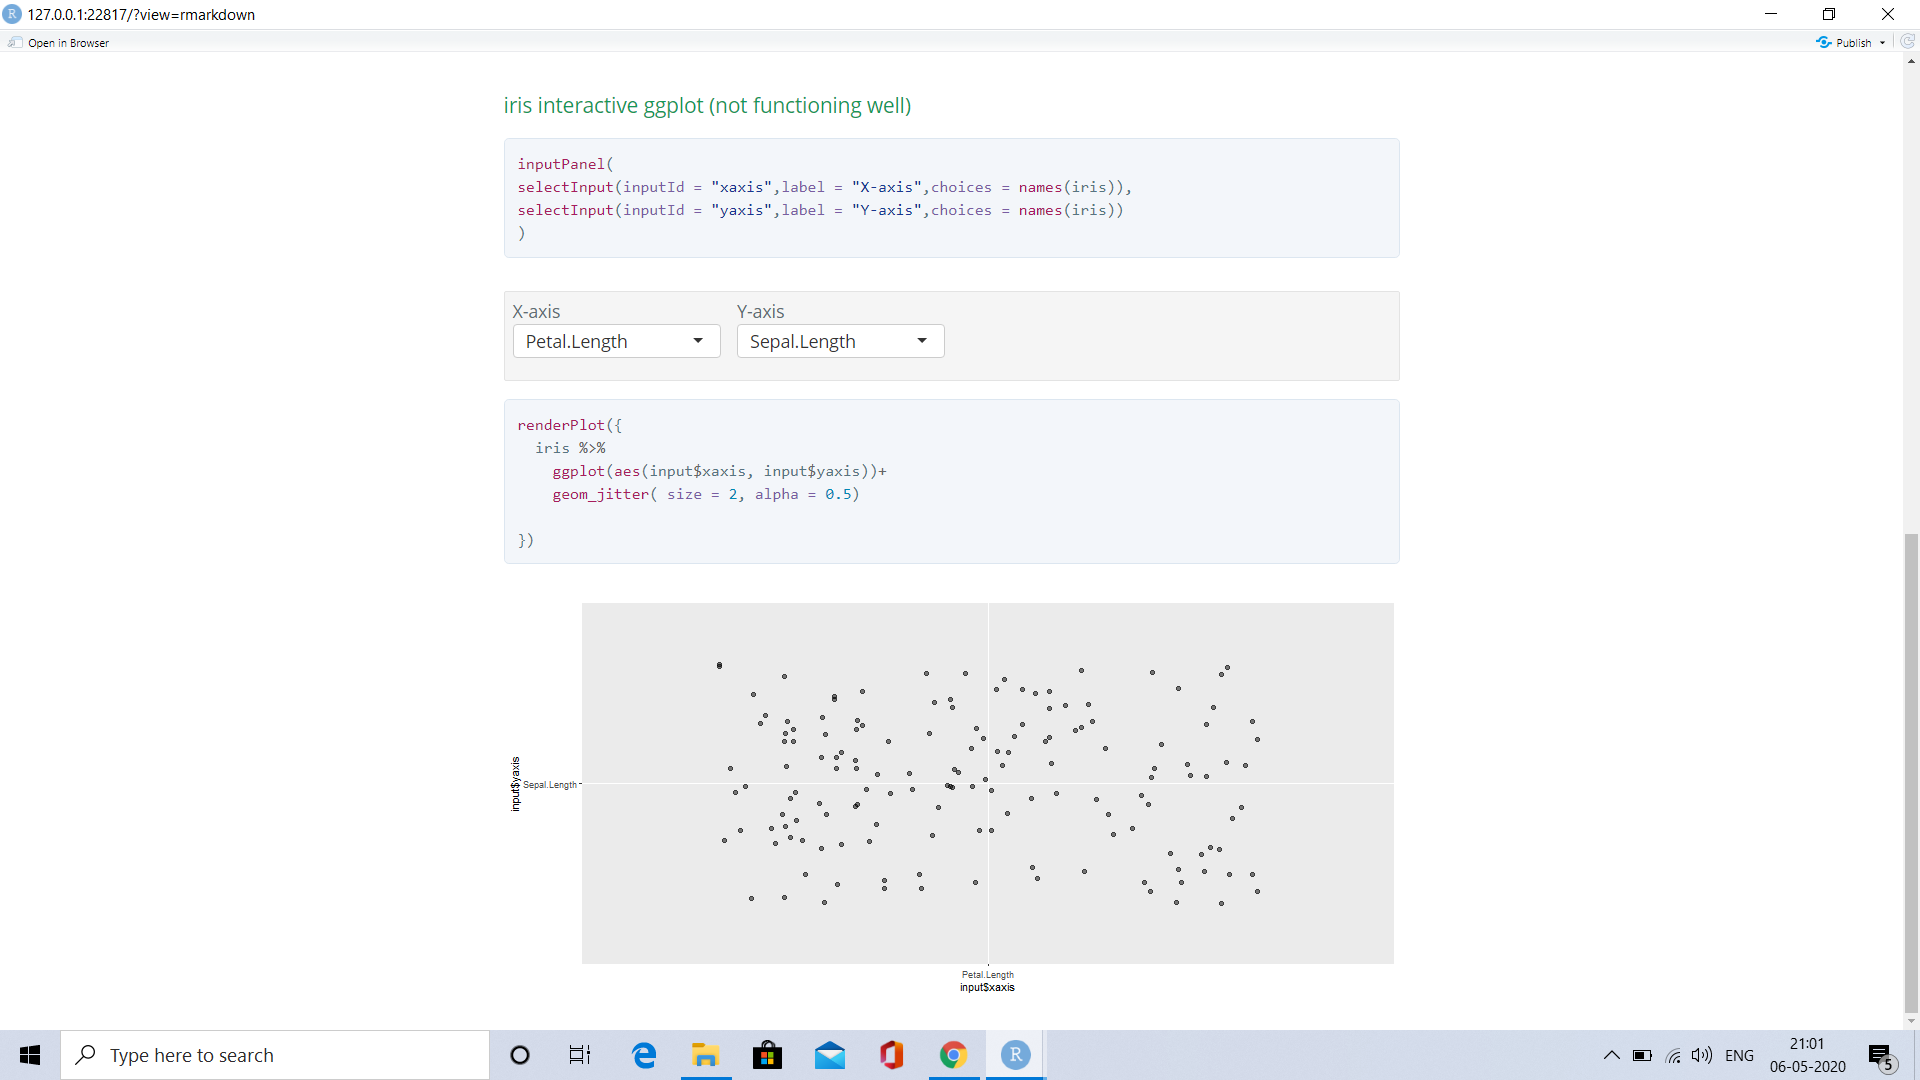
iris interactive ggplot (not functioning well)
inputPanel(
selectInput(inputId = "xaxis",label = "X-axis",choices = names(iris)),
selectInput(inputId = "yaxis",label = "Y-axis",choices = names(iris))
)

renderPlot({
  iris %>%
    ggplot(aes(input$xaxis, input$yaxis))+
    geom_jitter( size = 2, alpha = 0.5)

})
The pictures of the output are as follows:
1> The usual ggplot output with out the shiny bits
2> The ggplot widget