First of all, please cut the trash talk, we like to keep things polite here, now to the business. You can't compare Stata with R, the former is a statistical software the later is a programming language, more comparable to Python, so you have to change your mindset when working with R and realize you are programming now so you need to pay attention to syntax, it actually is not that hard it just takes some time to get used to it.
I have made a reproducible example with a small subset of your data (this is what I was asking you to do when I asked for a reprex, you should read the guide I gave you if you want to learn how to properly ask for help here).
library(tidyverse)
library(lubridate)
# Sample data on a copy/paste friendly format
CoinMetrics <- data.frame(
stringsAsFactors = FALSE,
date = c("18/07/2010","19/07/2010",
"20/07/2010","21/07/2010","22/07/2010","23/07/2010",
"24/07/2010","25/07/2010","26/07/2010","27/07/2010",
"28/07/2010","29/07/2010","30/07/2010","31/07/2010",
"01/08/2010","02/08/2010","03/08/2010","04/08/2010",
"05/08/2010","06/08/2010","07/08/2010","08/08/2010",
"09/08/2010","10/08/2010"),
AdrActCnt = c(860,929,936,784,594,655,
959,2130,1250,775,664,534,582,479,622,632,988,
715,825,640,500,581,782,590),
BlkCnt = c(172,174,181,207,176,194,
189,231,243,166,159,180,182,203,239,242,227,243,
218,147,155,199,190,191),
BlkSizeByte = c(136889,139254,197425,124991,
100750,103001,287193,744810,243769,126842,782644,
202582,111690,96037,103080,105999,189846,115865,
203888,128263,80699,105118,297418,91479),
BlkSizeMeanByte = c(795.8663,800.3103,1090.7459,
603.8213,572.4432,530.933,1519.5397,3224.2857,
1003.1646,764.1084,4922.2893,1125.4556,613.6813,473.0887,
431.2971,438.0124,836.326,476.8107,935.2661,872.5374,
520.6387,528.2312,1565.3579,478.9476),
CapMVRVCur = c(146.038332,62.56513,45.10663,
38.35756,25.132348,23.190988,17.071914,14.2948,
12.57111,12.410611,11.867736,13.541212,12.032902,
12.052866,10.448923,9.976204,9.604613,8.828838,9.19506,
9.025812,8.428757,8.477024,9.280854,8.883873)
)
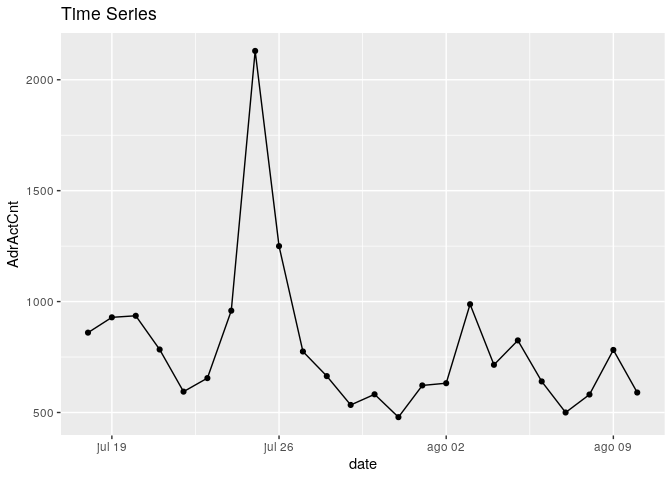
CoinMetrics %>%
mutate(date = dmy(date)) %>%
ggplot(aes(x = date, y = AdrActCnt)) +
geom_point() +
geom_line() +
labs(title = "Time Series")
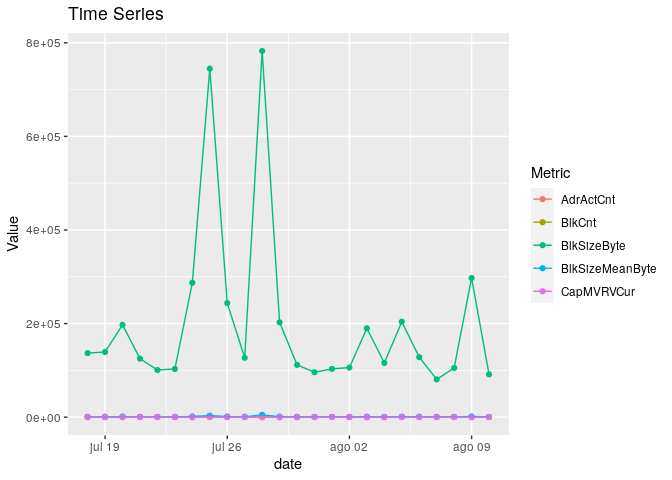
# You can also plot several variables at the same time
CoinMetrics %>%
    mutate(date = dmy(date)) %>%
    gather(Metric, Value, -date) %>%
    ggplot(aes(x = date, y = Value, color = Metric)) +
    geom_point() +
    geom_line() +
    labs(title = "Time Series")
Created on 2020-01-20 by the reprex package (v0.3.0.9000)