Error in plot.window(...) : need finite 'ylim' values help needed

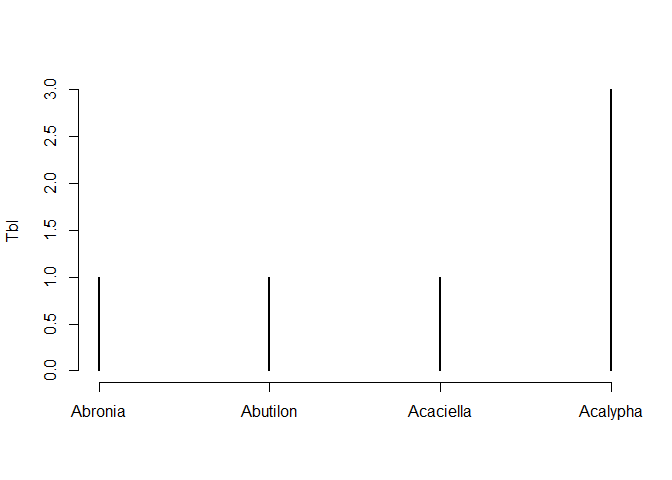
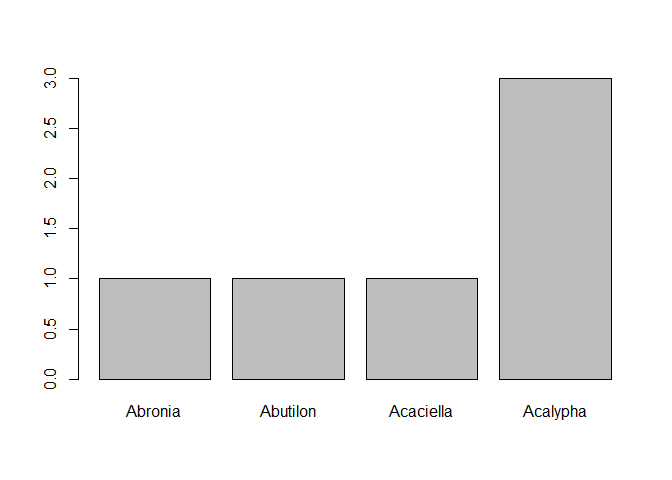
New to Rstudio and am getting this error. I am trying to plot a bar chart of the total number of each category such as Family and Genus. What am I doing wrong?

Error in plot.window(...) : need finite 'ylim' values
In addition: Warning messages:
1: In xy.coords(x, y, xlabel, ylabel, log) : NAs introduced by coercion
2: In min(x) : no non-missing arguments to min; returning Inf
3: In max(x) : no non-missing arguments to max; returning -Inf

Family Genus Species Native? C Physiognomy Duration Common Name

1 Nycta~ Abro~ fragra~ native 6 forb perenni~ sweet sand-v~
2 Malva~ Abut~ theoph~ non-nati~ 0 forb annual common velve~
3 Fabac~ Acac~ angust~ native 7 forb perenni~ prairie acac~
4 Eupho~ Acal~ deamii native 5 forb annual deams copper~
5 Eupho~ Acal~ monoco~ native 4 forb annual slender copp~
6 Eupho~ Acal~ ostryi~ native 0 forb annual rough-pod co~

tibble [2,306 x 8] (S3: tbl_df/tbl/data.frame)
Family : chr [1:2306] "Nyctaginaceae" "Malvaceae" "Fabaceae" "Euphorbiaceae" ... Genus : chr [1:2306] "Abronia" "Abutilon" "Acaciella" "Acalypha" ...
Species : chr [1:2306] "fragrans" "theophrasti" "angustissima" "deamii" ... Native? : chr [1:2306] "native" "non-native" "native" "native" ...
C : num [1:2306] 6 0 7 5 4 0 1 0 0 1 ... Physiognomy: chr [1:2306] "forb" "forb" "forb" "forb" ...
Duration : chr [1:2306] "perennial" "annual" "perennial" "annual" ... Common Name: chr [1:2306] "sweet sand-verbena" "common velvetleaf" "prairie acacia" "deams copperleaf" ...

Family Genus Species Native?
Length:2306 Length:2306 Length:2306 Length:2306
Class :character Class :character Class :character Class :character
Mode :character Mode :character Mode :character Mode :character

   C          Physiognomy          Duration         Common Name       

Min. : 0.000 Length:2306 Length:2306 Length:2306
1st Qu.: 0.000 Class :character Class :character Class :character
Median : 4.000 Mode :character Mode :character Mode :character
Mean : 3.737
3rd Qu.: 6.000
Max. :10.000

The plot function is finding that all of your values are NA. Please post the output of

dput(head(DF, 10))

where you replace DF with the actual name of your data frame. Please place a line containing only three back ticks, ```, before and after the pasted output.
```
Your output here
```
Also, post the plot() command you are using.

structure(list(Family = c("Nyctaginaceae", "Malvaceae", "Fabaceae", 
"Euphorbiaceae", "Euphorbiaceae", "Euphorbiaceae"), Genus = c("Abronia", 
"Abutilon", "Acaciella", "Acalypha", "Acalypha", "Acalypha"), 
    Species = c("fragrans", "theophrasti", "angustissima", "deamii", 
    "monococca", "ostryifolia"), `Native?` = c("native", "non-native", 
    "native", "native", "native", "native"), C = c(6, 0, 7, 5, 
    4, 0), Physiognomy = c("forb", "forb", "forb", "forb", "forb", 
    "forb"), Duration = c("perennial", "annual", "perennial", 
    "annual", "annual", "annual"), `Common Name` = c("sweet sand-verbena", 
    "common velvetleaf", "prairie acacia", "deams copperleaf", 
    "slender copperleaf", "rough-pod copperleaf")), row.names = c(NA, 
-6L), class = c("tbl_df", "tbl", "data.frame"))```


plot(plants$Genus)

Is this the sort of thing you are trying to do?

plants <- structure(list(Family = c("Nyctaginaceae", "Malvaceae", "Fabaceae", 
                                "Euphorbiaceae", "Euphorbiaceae", "Euphorbiaceae"), 
                     Genus = c("Abronia", "Abutilon", "Acaciella", "Acalypha", "Acalypha", "Acalypha"), 
                     Species = c("fragrans", "theophrasti", "angustissima", "deamii", "monococca", "ostryifolia"), 
                     Native = c("native", "non-native", "native", "native", "native", "native"), 
                     C = c(6, 0, 7, 5, 4, 0), 
                     Physiognomy = c("forb", "forb", "forb", "forb", "forb", "forb"), 
                     Duration = c("perennial", "annual", "perennial", "annual", "annual", "annual"), 
                     Common_Name = c("sweet sand-verbena", "common velvetleaf", "prairie acacia", "deams copperleaf", "slender copperleaf", "rough-pod copperleaf")), 
                row.names = c(NA,-6L), class = c("tbl_df", "tbl", "data.frame"))

Tbl <- table(plants$Genus) #counts how many occurences of each Genus
plot(Tbl)

barplot(Tbl)

Created on 2020-12-11 by the reprex package (v0.3.0)

yes, something like that.

Family <- table(plant_list$Family)
barplot(Family)
plot(Family,
main = "Plant Families of Missouri",
ylab = "Quantity",
xlab = "Families")

Figured it out. But how do I label all categories on the x axis?

You can rotate the x axis labels with the las parameter and you can shrink the axis text with cex.axis.

plot(Tbl, las = 2, cex.axis = 0.5)

I do not think you can make a legible axis unless you print to a much larger device than the little pane in RStudio. On Windows you can use the windows() function and on Linux (and Mac, I think) you can use x11(). For example, run

windows(width = 14, height = 9)

and then your plot command.

This topic was automatically closed 21 days after the last reply. New replies are no longer allowed.

If you have a query related to it or one of the replies, start a new topic and refer back with a link.