Hi everyone, I have an error in make errorbar in a bar graph. Could anyone help me please?
Here is my code:
p <- ggplot(data1, aes(x=disease, y=newsbsn)) +
and it showed
Error: Aesthetics must be either length 1 or the same as the data (107): ymaxrlang::last_error() to see where the error occurred.
I assume data1$se exists? or se?
TrangHoang:
p <- ggplot(data1, aes(x=disease, y=newsbsn)) +
once the se column is provided into data1, I expect a subsequent error from the NULL ymin param on errorbar
It is se.
library(tidyverse)
data1 <- data.frame(
disease=letters[1:2],
newsbsn=sample.int(2,2)
# ,se=sample.int(2,2)
)
(p <- ggplot(data1, aes(x=disease, y=newsbsn)) +
geom_col(fill= "blue", colour="black") +
geom_errorbar(aes(ymin=newsbsn, ymax=newsbsn+se), width=.2))
# object se not found
data2 <- data.frame(
disease=letters[1:2],
newsbsn=sample.int(2,2),
se=sample.int(2,2)
)
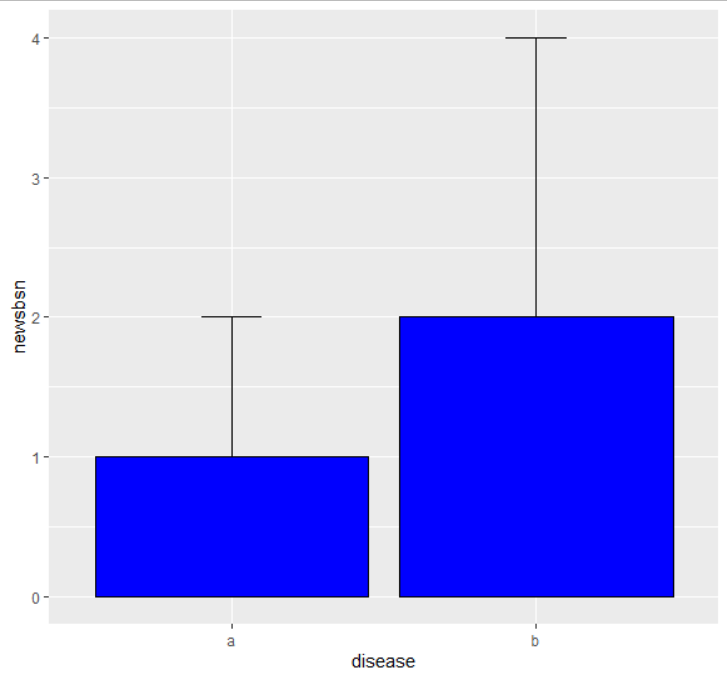
(p2 <- ggplot(data2, aes(x=disease, y=newsbsn)) +
geom_col(fill= "blue", colour="black") +
geom_errorbar(aes(ymin=newsbsn, ymax=newsbsn+se), width=.2))
I mutated a se column in data1,
p <- ggplot(error, aes(x=disease, y=newsbsn)) +
p
I would guess that your data isn't summarised, hence the problem
system
November 28, 2020, 7:37am
8
This topic was automatically closed 21 days after the last reply. New replies are no longer allowed.