I am using a code I was given that will create a looped series of multiple pie charts but I keep receiving an error code. The code is
Error in [.data.frame(county.data, 1, Col.2008) :
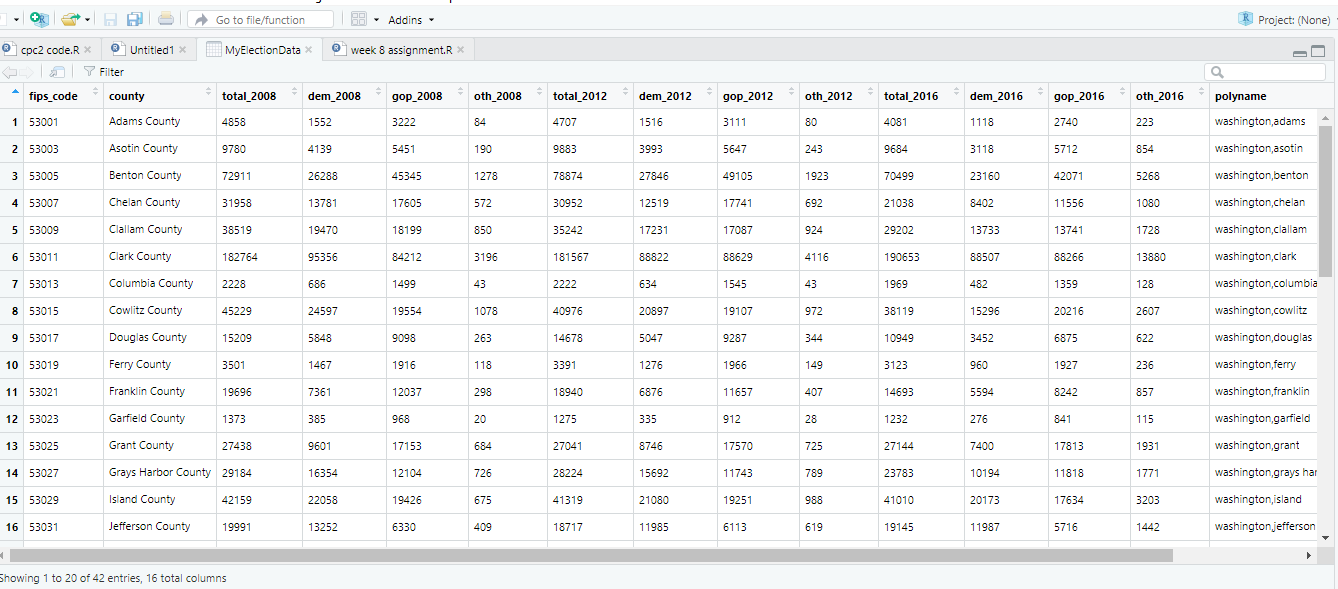
undefined columns selected.
Can you please help. code is as follows
Counties <- c ("King County", "Pierce County", "Snohomish County")
Col.2008 <- c("gop_2008","dem_2008","other_2008")
Col.2012 <- c("gop_2012","dem_2012","other_2012")
Col.2016 <- c("gop_2016","dem_2016","other_2016")
labels <- c("GOP","Dem","Other")
colors <- c("Red","Blue","Green")
for (county in Counties)
{
county.data <- MyElectionData[MyElectionData$county==county,]
pie(as.numeric(county.data[1,Col.2008]),
labels = labels, col = colors, main = paste(county,"2008"))
pie(as.numeric(county.data[1,Col.2012]),
labels = labels, col = colors, main = paste(county,"2012"))
pies(as.numeric(county.data[1,Col.2016]),
labels=labels, col=colors, main=paste(county,"2016"))
}