Error in `check_aesthetics()

I have been receiving Errors in aesthetics() for the plot. I have tried different approaches and read a lot about it but to no solution. Can someone detect where I have been going wrong?
This is my code

library("xlsx")
Sheet <- read.xlsx(file.choose(),1)

library(dplyr)
df <- Sheet
view(df)

library(dplyr)
df.summary <- df %>%
group_by(Object,Colour) %>%
summarise(
mn = mean(A., na.rm = TRUE),
sd = sd(A., na.rm = TRUE)
)
df.summary

ggplot(df.summary, aes(Object, df$A.)) +
geom_errorbar(
aes(ymin = mn-sd, ymax = mn+sd, color = df$Colour),
position = position_dodge(0.3), width = 0.2
)+
geom_point(aes(color = df$Colour), position = position_dodge(0.3)) +
scale_color_manual(values = c("#00AFBB", "#E7B800", "#00FF00"))

This is the data example I export from excel

Community

The error reads as this

Error in check_aesthetics():
! Aesthetics must be either length 1 or the same as the data (5): colour and y
Run rlang::last_error() to see where the error occurred.

You can't mix variables from different data frames within the same aesthetic specification, if you can provide a proper REPRoducible EXample (reprex) illustrating your issue maybe we can give you an alternative approach.

library("xlsx")
df <- read.xlsx(file.choose(),1)
#> Error in file.choose(): file choice cancelled

library(datapasta)
datapasta::df_paste(head(df, 13)[,c('Object', 'Colour', 'A.')])
#> Error in unclass(x)[...]: subscript out of bounds

data.frame(
  stringsAsFactors = FALSE,
                          Object = c("Bag","shoe","shoe","belt","shoe","belt",
                                     "belt","Bag","Bag","belt","belt",
                                     "Bag"),
                          Colour = c("red","black","black","red","black",
                                     "blue","blue","red","blue","red","red",
                                     "blue"),
                              A. = c(113,
                                     34,NA,9,11,28,41,66,12,NA,17,18)
              )
#>    Object Colour  A.
#> 1     Bag    red 113
#> 2    shoe  black  34
#> 3    shoe  black  NA
#> 4    belt    red   9
#> 5    shoe  black  11
#> 6    belt   blue  28
#> 7    belt   blue  41
#> 8     Bag    red  66
#> 9     Bag   blue  12
#> 10   belt    red  NA
#> 11   belt    red  17
#> 12    Bag   blue  18

library(dplyr)
#> 
#> Attaching package: 'dplyr'
#> The following objects are masked from 'package:stats':
#> 
#>     filter, lag
#> The following objects are masked from 'package:base':
#> 
#>     intersect, setdiff, setequal, union
df.summary <- df %>%
  group_by(Object,Colour) %>%
  summarise(
    mn = mean(A., na.rm = TRUE),
    sd = sd(A., na.rm = TRUE)
  )
#> Error in UseMethod("group_by"): no applicable method for 'group_by' applied to an object of class "function"

library(ggplot2)

ggplot(df.summary, aes(Object, df$A.)) +
  geom_errorbar(
    aes(ymin = mn-sd, ymax = mn+sd, color = df$Colour),
    position = position_dodge(0.3), width = 0.2
  )+
  geom_point(aes(color = df$Colour), position = position_dodge(0.3)) +
  scale_color_manual(values = c("#00AFBB", "#E7B800", "#00FF00")) 
#> Error in ggplot(df.summary, aes(Object, df$A.)): object 'df.summary' not found

Created on 2022-05-01 by the reprex package (v2.0.1)

Is the code below close to what you want? I made two version of the plot. The first one uses or original colors and in the second I adjusted the color hex codes to more closely match the displayed color with the labelling in the legend.

library(dplyr)
library(ggplot2)
df <- data.frame(
  stringsAsFactors = FALSE,
  Object = c("Bag","shoe","shoe","belt","shoe","belt",
             "belt","Bag","Bag","belt","belt",
             "Bag"),
  Colour = c("red","black","black","red","black",
             "blue","blue","red","blue","red","red",
             "blue"),
  A. = c(113,
         34,NA,9,11,28,41,66,12,NA,17,18)
)
df.summary <- df %>%
  group_by(Object,Colour) %>%
  summarise(
    mn = mean(A., na.rm = TRUE),
    sd = sd(A., na.rm = TRUE)
  )
#> `summarise()` has grouped output by 'Object'. You can override using the `.groups` argument.
ggplot(df.summary, aes(Object, mn)) +
  geom_errorbar(
    aes(ymin = mn-sd, ymax = mn+sd, color = Colour),
    position = position_dodge(0.3), width = 0.2
  ) +
  geom_point(aes(color = Colour), position = position_dodge(0.3)) +
  scale_color_manual(values = c("#00AFBB", "#E7B800", "#00FF00")) 

ggplot(df.summary, aes(Object, mn)) +
  geom_errorbar(
    aes(ymin = mn-sd, ymax = mn+sd, color = Colour),
    position = position_dodge(0.3), width = 0.2
  ) +
  geom_point(aes(color = Colour), position = position_dodge(0.3)) +
  scale_color_manual(values = c("#000000", "#0000FF", "#FF0000")) 

Created on 2022-05-01 by the reprex package (v2.0.1)

Thanks for the feedback and for both suggestive codes. It was really helpful.

But can the plot be made as Object on the x-axis and A on the y axis whiles maintaining a similar errorbar()

The y axis is the mean of A. Do you want the label of the y axis to be different or some other change to the plot? The error bars you have calculated can only be displayed in a meaningful way, I think, when you display the mean.

Thanks for the explanation.

library(datapasta)
datapasta::df_paste(head(df, 13)[,c('Object', 'Colour', 'A.')])
#> Error in unclass(x)[...]: subscript out of bounds


data.frame(
  stringsAsFactors = FALSE,
                           Object = c("Bag","shoe","shoe","belt","shoe",
                                      "belt","belt","Bag","Bag","belt","belt",
                                      "Bag"),
                           Colour = c("red","black","black","red","black",
                                      "blue","blue","red","blue","red","red",
                                      "blue"),
                               A. = c(113,34,NA,9,11,28,41,66,12,NA,17,
                                      18)
               )
#>    Object Colour  A.
#> 1     Bag    red 113
#> 2    shoe  black  34
#> 3    shoe  black  NA
#> 4    belt    red   9
#> 5    shoe  black  11
#> 6    belt   blue  28
#> 7    belt   blue  41
#> 8     Bag    red  66
#> 9     Bag   blue  12
#> 10   belt    red  NA
#> 11   belt    red  17
#> 12    Bag   blue  18

library(dplyr)
#> 
#> Attaching package: 'dplyr'
#> The following objects are masked from 'package:stats':
#> 
#>     filter, lag
#> The following objects are masked from 'package:base':
#> 
#>     intersect, setdiff, setequal, union
df.summary2 <- df %>%
  group_by(Object,Colour) %>%
  summarise(
    mn = mean(A., na.rm = TRUE),
    sd = sd(A., na.rm = TRUE)
  )
#> Error in UseMethod("group_by"): no applicable method for 'group_by' applied to an object of class "function"

#ErrorBar plot
ggplot(df.summary2, aes(Object, mn)) +
  geom_errorbar(
    aes(ymin = mn-sd, ymax = mn+sd, color = Colour),
    position = position_dodge(0.3), width = 0.2
  ) +
  geom_point(aes(color = Colour), position = position_dodge(0.3)) +
  scale_color_manual(values = c("#00AFBB", "#E7B800", "#00FF00"))+
  geom_line(aes(group = Colour, color= Colour),data = df.summary2)
#> Error in ggplot(df.summary2, aes(Object, mn)): could not find function "ggplot"

## point plot
ggplot(df) +
  aes(Object, A.) +
  theme_minimal() +
  geom_point(aes(color = Colour), position = position_dodge(0.3)) +
  scale_color_manual(values = c("#000000", "#0000FF", "#FF0000"))+
  scale_fill_hue(direction = 1)
#> Error in ggplot(df): could not find function "ggplot"

Created on 2022-05-03 by the reprex package (v2.0.1)

With the same data created earlier, I wanted to add the errorbar and individual points on the same plot, not side by side but I wanted the individual plots and the error bar together. If that isn't possible, can you suggest how to create a bar plot and add the error bars with the jitter points?

I am not sure exactly what you want to plot. Here is a plot made with just a couple of changes to your code. Is it close to what you want?

library(dplyr)
library(ggplot2)
df <- data.frame(
  stringsAsFactors = FALSE,
  Object = c("Bag","shoe","shoe","belt","shoe",
             "belt","belt","Bag","Bag","belt","belt",
             "Bag"),
  Colour = c("red","black","black","red","black",
             "blue","blue","red","blue","red","red",
             "blue"),
  A. = c(113,34,NA,9,11,28,41,66,12,NA,17,
         18)
)

df.summary2 <- df %>%
  group_by(Object,Colour) %>%
  summarise(
    mn = mean(A., na.rm = TRUE),
    sd = sd(A., na.rm = TRUE)
  )
#> `summarise()` has grouped output by 'Object'. You can override using the `.groups` argument.

ggplot(df.summary2, aes(Object, mn)) +
  geom_errorbar(
    aes(ymin = mn-sd, ymax = mn+sd, color = Colour),
    position = position_dodge(0.3), width = 0.2
  ) +
  geom_point(aes(y = A., color = Colour), position = position_dodge(0.3),data = df) +
  scale_color_manual(values = c("#00AFBB", "#E7B800", "#00FF00")) +
  geom_line(aes(group = Colour, color= Colour),data = df.summary2)
#> Warning: Removed 2 rows containing missing values (geom_point).

Created on 2022-05-03 by the reprex package (v2.0.1)

Yes, the code worked perfectly for me. I am grateful

datapasta::df_paste(head(df,45)[,c('A.','Object','Colour')])
#> Error in unclass(x)[...]: subscript out of bounds


data.frame(
  stringsAsFactors = FALSE,
                               A. = c(113,34,NA,9,11,28,41,66,12,23.2,
                                      22.8,21.7,22.7,22.2,21.7,22.5,23.4,
                                      NA,23.6,21.3,22.8,17.8,23.1,23.5,
                                      22.3,25.6,23.6,23.7,23.9,22.6,22.9,
                                      23.7,26.2,24.3,21.9,22.5,25.2,22.6,
                                      24.1,26.1,23,24,23.9,26.7,NA),
                           Object = c("Bag","shoe","shoe","belt","shoe",
                                      "belt","belt","Bag","Bag","belt","belt",
                                      "Bag","Bag","shoe","shoe","belt",
                                      "shoe","belt","belt","Bag","Bag","belt",
                                      "Bag","shoe","shoe","belt","shoe",
                                      "belt","belt","Bag","shoe","shoe","belt",
                                      "shoe","belt","belt","Bag","shoe",
                                      "shoe","belt","shoe","belt","belt",
                                      "Bag",NA),
                           Colour = c("red","black","black","red","black",
                                      "blue","blue","red","blue","red","red",
                                      "blue","red","black","black","red",
                                      "black","blue","blue","red","red",
                                      "black","black","red","black","blue",
                                      "blue","red","red","black","black","red",
                                      "black","blue","blue","red","red",
                                      "black","black","red","black","blue",
                                      "blue","red",NA)
               )
#>       A. Object Colour
#> 1  113.0    Bag    red
#> 2   34.0   shoe  black
#> 3     NA   shoe  black
#> 4    9.0   belt    red
#> 5   11.0   shoe  black
#> 6   28.0   belt   blue
#> 7   41.0   belt   blue
#> 8   66.0    Bag    red
#> 9   12.0    Bag   blue
#> 10  23.2   belt    red
#> 11  22.8   belt    red
#> 12  21.7    Bag   blue
#> 13  22.7    Bag    red
#> 14  22.2   shoe  black
#> 15  21.7   shoe  black
#> 16  22.5   belt    red
#> 17  23.4   shoe  black
#> 18    NA   belt   blue
#> 19  23.6   belt   blue
#> 20  21.3    Bag    red
#> 21  22.8    Bag    red
#> 22  17.8   belt  black
#> 23  23.1    Bag  black
#> 24  23.5   shoe    red
#> 25  22.3   shoe  black
#> 26  25.6   belt   blue
#> 27  23.6   shoe   blue
#> 28  23.7   belt    red
#> 29  23.9   belt    red
#> 30  22.6    Bag  black
#> 31  22.9   shoe  black
#> 32  23.7   shoe    red
#> 33  26.2   belt  black
#> 34  24.3   shoe   blue
#> 35  21.9   belt   blue
#> 36  22.5   belt    red
#> 37  25.2    Bag    red
#> 38  22.6   shoe  black
#> 39  24.1   shoe  black
#> 40  26.1   belt    red
#> 41  23.0   shoe  black
#> 42  24.0   belt   blue
#> 43  23.9   belt   blue
#> 44  26.7    Bag    red
#> 45    NA   <NA>   <NA>


df.summary <- df %>%
  group_by(Object,Colour) %>%
  summarise(
    mn = mean(A., na.rm = TRUE),
    sd = sd(A., na.rm = TRUE)
  )
#> Error in df %>% group_by(Object, Colour) %>% summarise(mn = mean(A., na.rm = TRUE), : could not find function "%>%"
#> `summarise()` has grouped output by 'Object'. You can override using the `.groups` argument.
ggplot(df.summary, aes(Object, mn)) +
  geom_errorbar(
    aes(ymin = mn-sd, ymax = mn+sd, color = Colour),
    position = position_dodge(0.3), width = 0.2
  ) +
  geom_point(aes(color = Colour), position = position_dodge(0.3)) +
  scale_color_manual(values = c("#00AFBB", "#E7B800", "#00FF00")) +
  geom_line(aes(group = Colour),data = df.summary)+
  geom_col(fill = alpha("#2C77BF", .3))+
geom_col(aes(y = A.),fill = alpha("#2C77BF", .009), position = position_dodge(0.3), data= df)
#> Error in ggplot(df.summary, aes(Object, mn)): could not find function "ggplot"

Created on 2022-05-04 by the reprex package (v2.0.1)

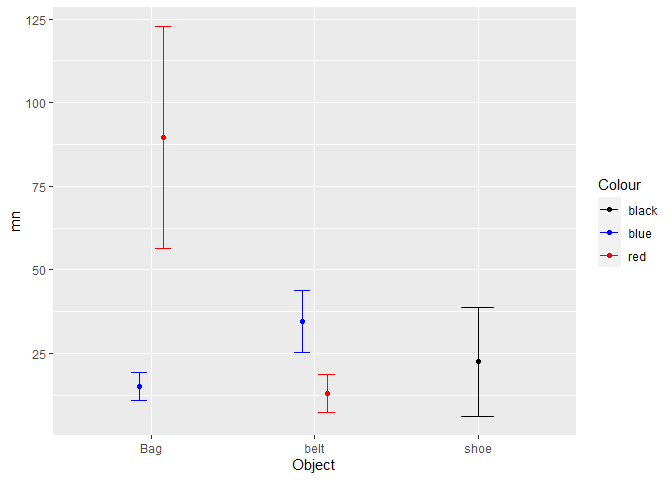
This image style is what I am targeting to achieve

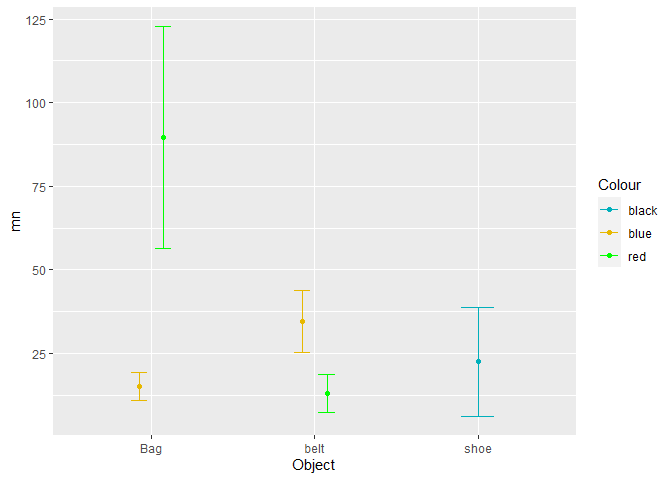
But this is an example of the image I have gotten from my codes
Rplot01

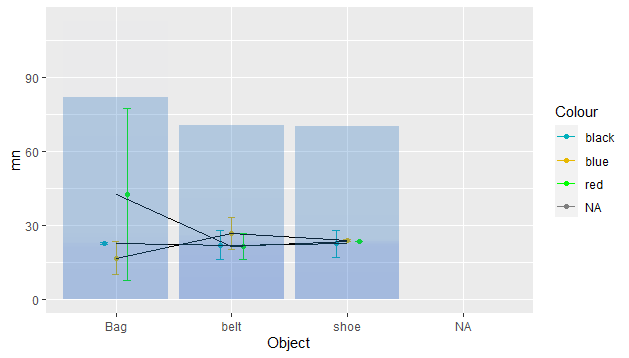
Can you help with the codes for the geom_col(). I am thinking that is where I am getting wrongly

The image you are aiming towards doesn't use geom_line, so you could remove that from your version ?
it also has a particular x axis, and the bars are a segmentation within that. What are your equivalent categories?
perhaps object should split your bars, and some other category should go on your x axis

Thanks for your response. Noted rightly, I have removed the geo _line.
The bars are segmented on the "Object" as a variable by "Colour " as the variable. The mean calculated for each group "mn" is for the y axis from the > df.summary

This topic was automatically closed 21 days after the last reply. New replies are no longer allowed.

If you have a query related to it or one of the replies, start a new topic and refer back with a link.