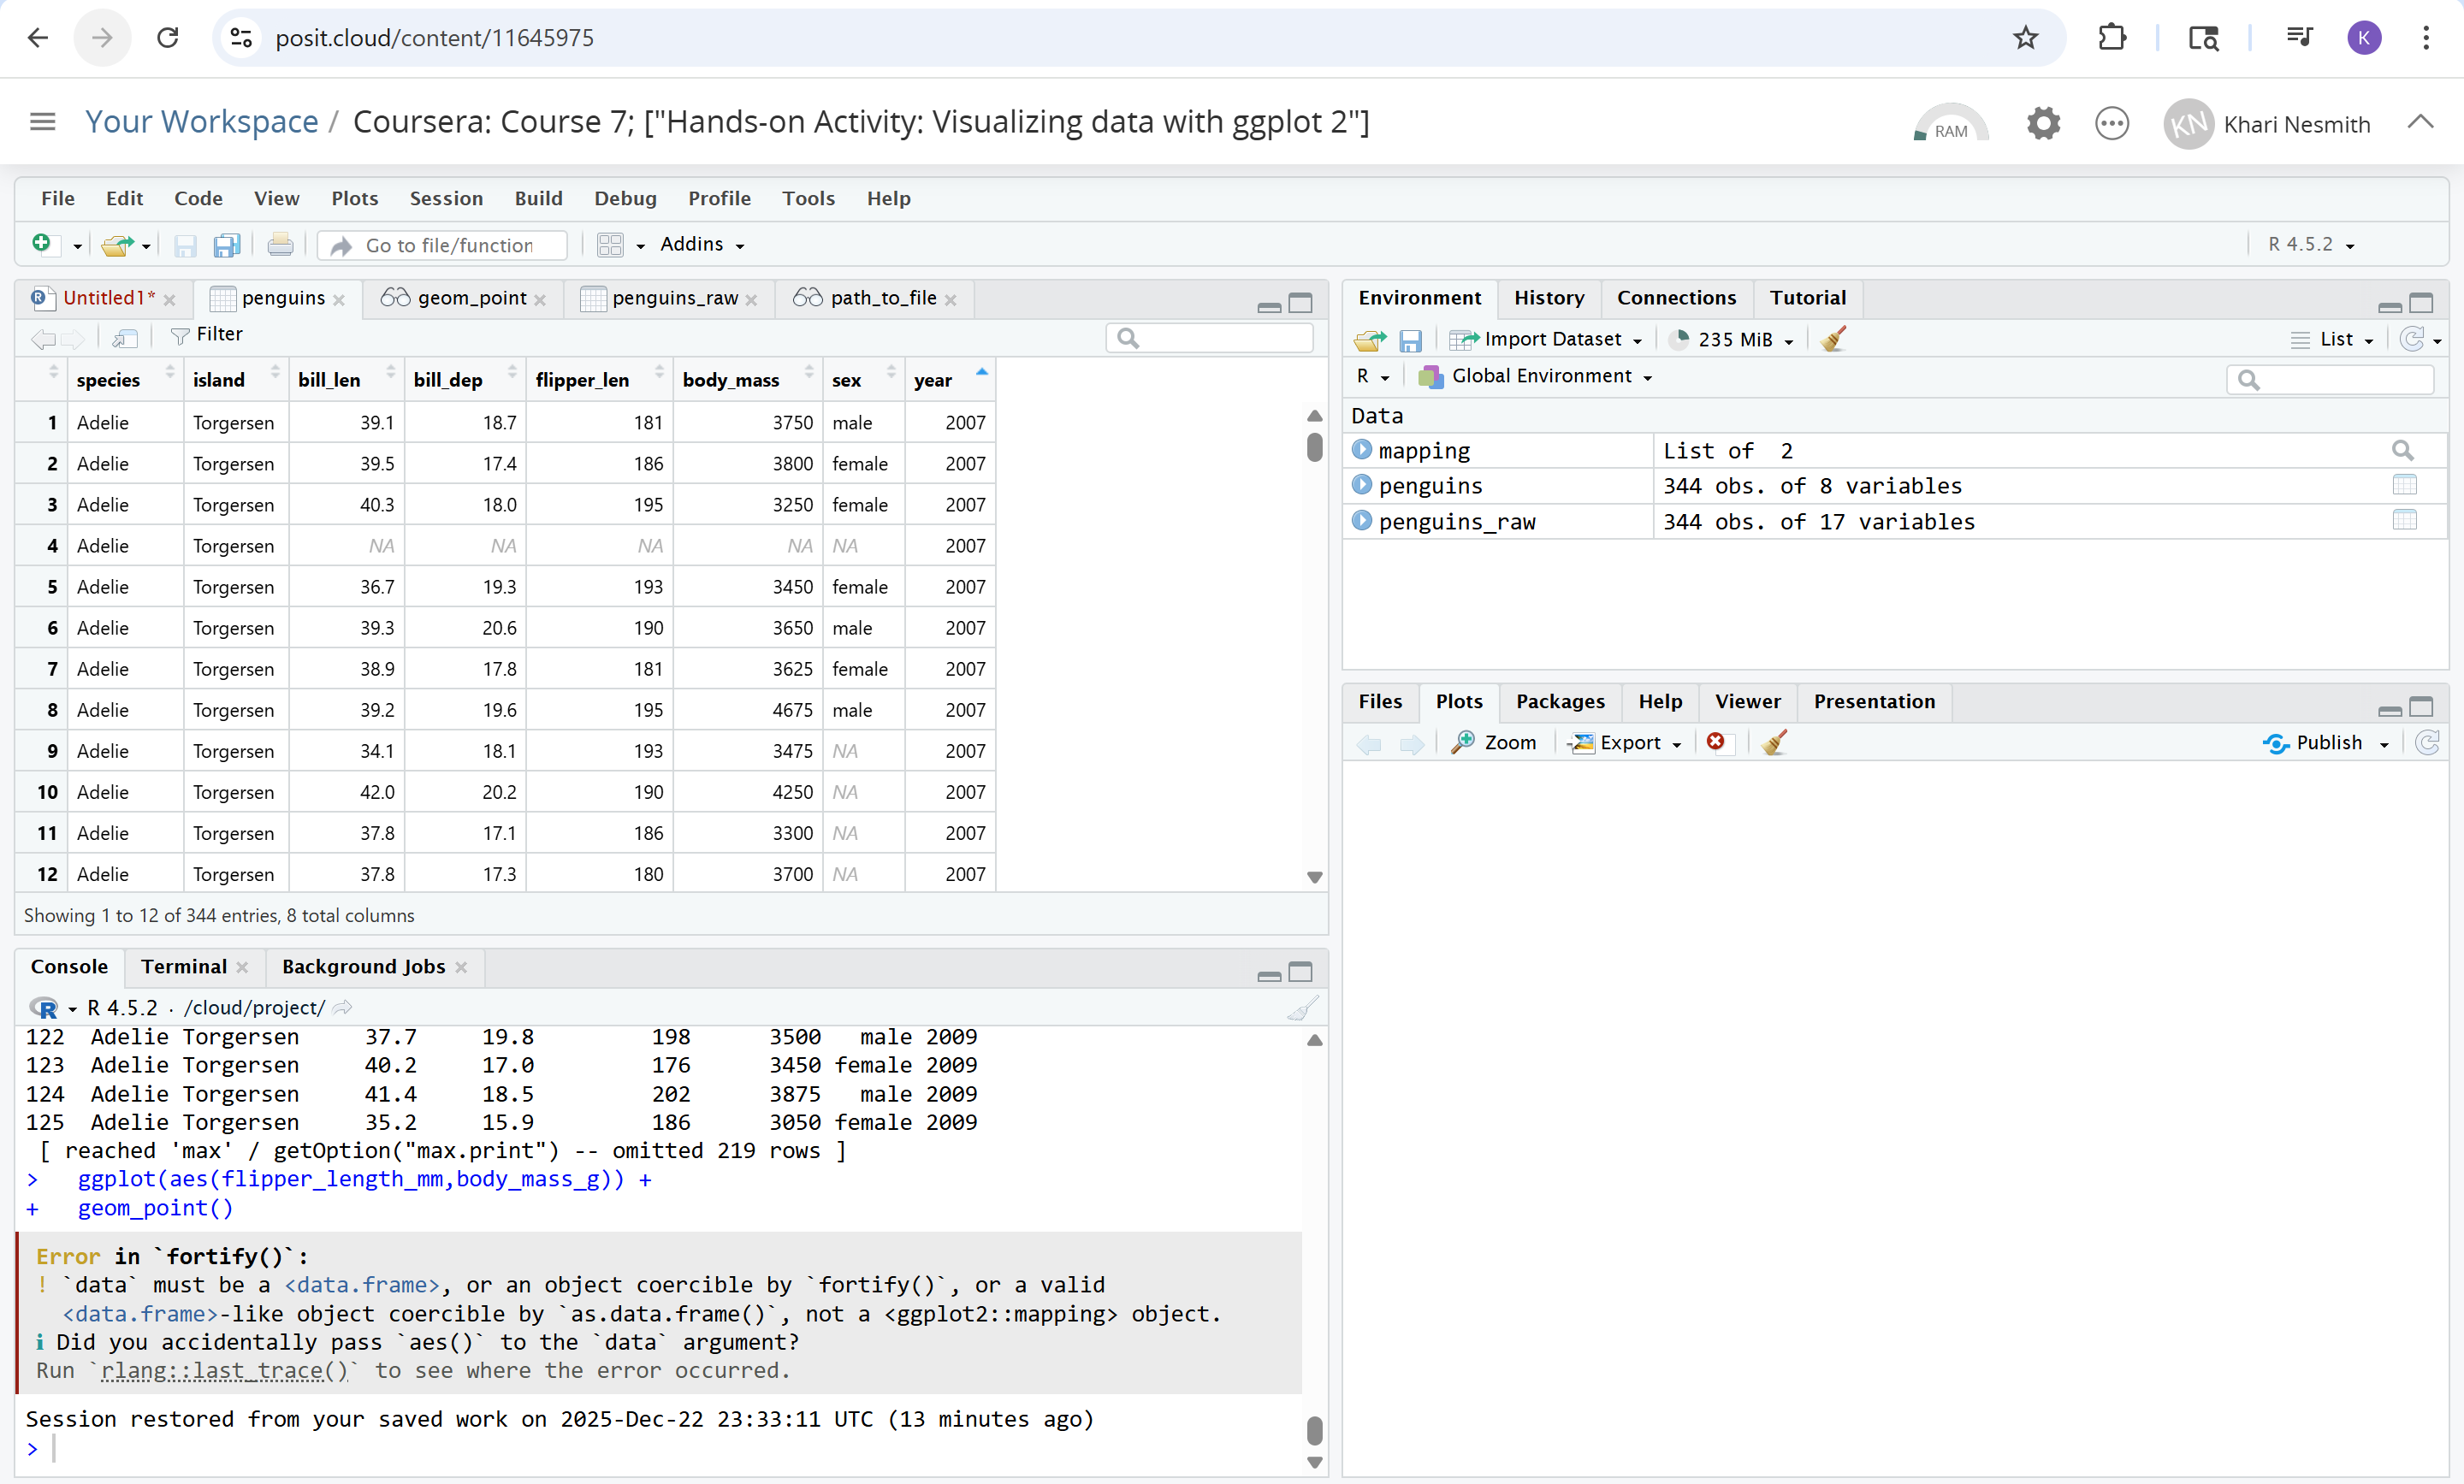
I encountered an error while running the code "ggplot(data=penguins + geom_point(mapping=aes(x=flipper_length_mm, y=body_mass_g))" to create a data vis.
(scatterplot chart).
Does anyone know how to solve this error as diplayed by this code above and the image I took of this problem located in the RStudio console?
The geom_point(...) command refers to variables named "flipper_length_mm" and "body_mass_g", but the penguins data frame has "flipper_len" and "body_mass". So you are referring to variables that do not exist.
Which names needed to be edited to match the ones in the columns of the "penguins" dataset?
Do I need to edit the title of the Rscript too?
EDIT: I tried writing in differen formats of the same code i was struggling with to run the scatter plot but kept recieving the blank in the "Plots" tab page.
You are working with a different penguins dataset, it's not palmerpenguins::penguins but datasets::penguins, which is bundled with R since version 4.5. Your course material probably predates this change.
Make sure you have loaded palmerpenguins package (note how it warns you about masking dataset objects from datasets package):
library(ggplot2)
ibrary(palmerpenguins)
#>
#> Attaching package: 'palmerpenguins'
#> The following objects are masked from 'package:datasets':
#>
#>     penguins, penguins_raw
ggplot(data = penguins) +
  geom_point(mapping = aes(x = flipper_length_mm, y = body_mass_g))
Or use palmerpenguins::penguins instead of penguins in your code:
Main difference between palmerpenguins::penguins and datasets::penguins is column names, to update your ggplot code to work with datasets::penguins, you'd need to change all occurrences of those column names:
str(palmerpenguins::penguins)
#> tibble [344 × 8] (S3: tbl_df/tbl/data.frame)
#>  $ species          : Factor w/ 3 levels "Adelie","Chinstrap",..: 1 1 1 1 1 1 1 1 1 1 ...
#>  $ island           : Factor w/ 3 levels "Biscoe","Dream",..: 3 3 3 3 3 3 3 3 3 3 ...
#>  $ bill_length_mm   : num [1:344] 39.1 39.5 40.3 NA 36.7 39.3 38.9 39.2 34.1 42 ...
#>  $ bill_depth_mm    : num [1:344] 18.7 17.4 18 NA 19.3 20.6 17.8 19.6 18.1 20.2 ...
#>  $ flipper_length_mm: int [1:344] 181 186 195 NA 193 190 181 195 193 190 ...
#>  $ body_mass_g      : int [1:344] 3750 3800 3250 NA 3450 3650 3625 4675 3475 4250 ...
#>  $ sex              : Factor w/ 2 levels "female","male": 2 1 1 NA 1 2 1 2 NA NA ...
#>  $ year             : int [1:344] 2007 2007 2007 2007 2007 2007 2007 2007 2007 2007 ...
to these:
str(datasets::penguins)
#> 'data.frame':    344 obs. of  8 variables:
#>  $ species    : Factor w/ 3 levels "Adelie","Chinstrap",..: 1 1 1 1 1 1 1 1 1 1 ...
#>  $ island     : Factor w/ 3 levels "Biscoe","Dream",..: 3 3 3 3 3 3 3 3 3 3 ...
#>  $ bill_len   : num  39.1 39.5 40.3 NA 36.7 39.3 38.9 39.2 34.1 42 ...
#>  $ bill_dep   : num  18.7 17.4 18 NA 19.3 20.6 17.8 19.6 18.1 20.2 ...
#>  $ flipper_len: int  181 186 195 NA 193 190 181 195 193 190 ...
#>  $ body_mass  : int  3750 3800 3250 NA 3450 3650 3625 4675 3475 4250 ...
#>  $ sex        : Factor w/ 2 levels "female","male": 2 1 1 NA 1 2 1 2 NA NA ...
#>  $ year       : int  2007 2007 2007 2007 2007 2007 2007 2007 2007 2007 ...
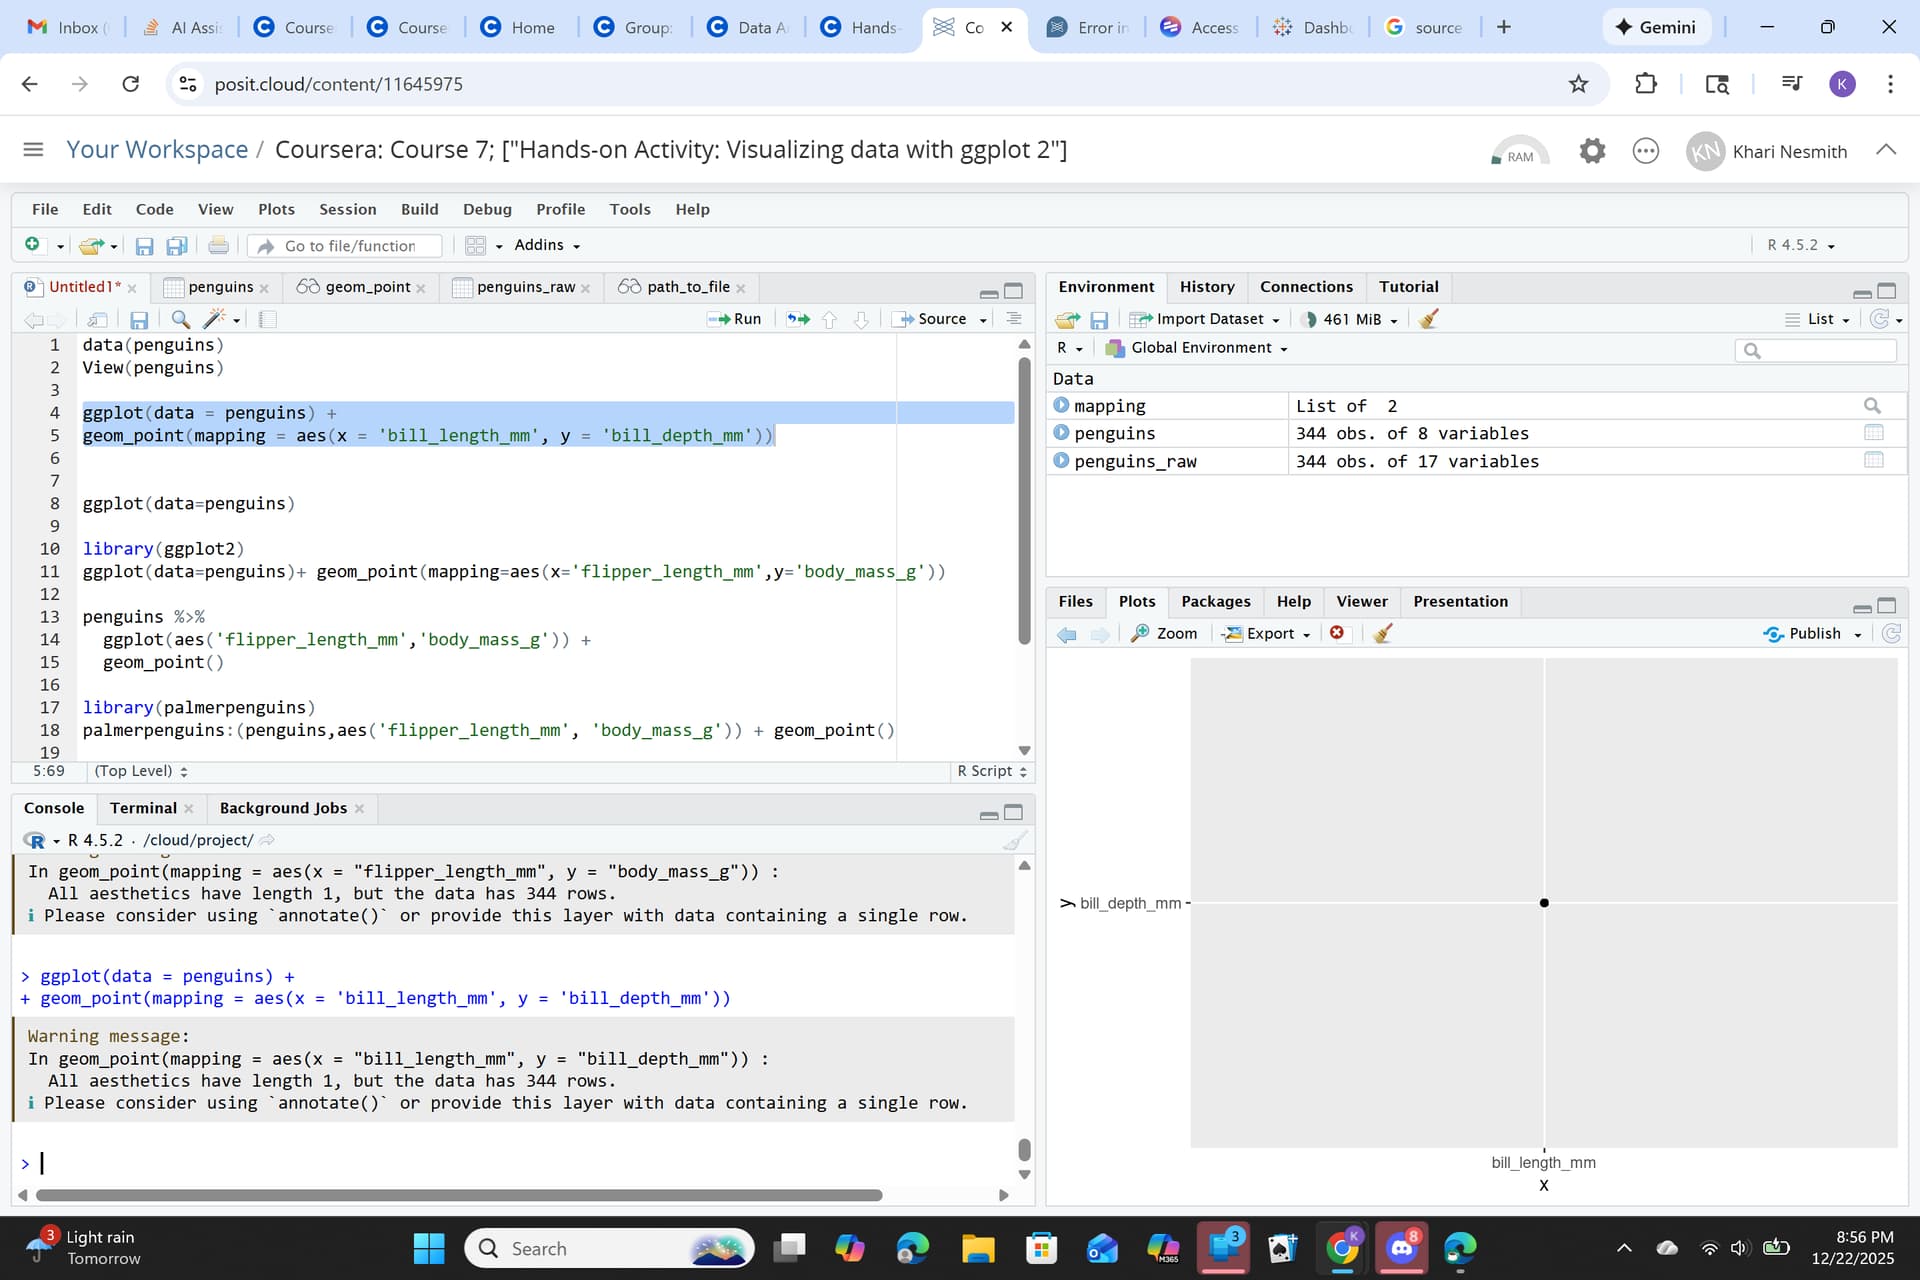
I tried out the code "ggplot(data = penguins) + geom_point = aes(x = 'bill_length, y = 'bill_depth_mm')), and it finally showed a scatterplot. However it only show one dot in the middle of the chart.
I changed (data = penguins) to (data = palmerpenguins :: penguins) in ggplot 2 paranthesis function, and removed codes from "flipper_length" and "body_mass".
Then the code for ggplot actually showed more than one point in the scatterplot chart. One of the example shown in one of the messages above actually worked.