ERROR futurePlot

Hi, im working on a employee churn prediction, and i want to use this code:

featurePlot(x=final[,3:12],y=final$Label,plot ="density",auto.key = list(columns = 2))

This gives me as a result : NULL
im working with this library`s caret, lattice, ggplot2, dplyr and readxl

in x column 3 is Age, and his data type is "num".
column 12 is Month working in the company, and his data type is "num". It's like 3 , 110, 150 etc.
and Label is about "Active", "Terminated" with data type "chr"

So i don't know why R give me this result, I was expecting the plot
I speak Spanish and English

I think you should use factors rather than characters.


library(caret)
d<- iris
d$Species <- as.character(d$Species)
featurePlot(x=d[,1:4],y=d$Species,plot ="density",auto.key = list(columns = 2))

this gives NULL as per you issue
but then if you comment out the as.character transformation , you get a plot

2 Likes

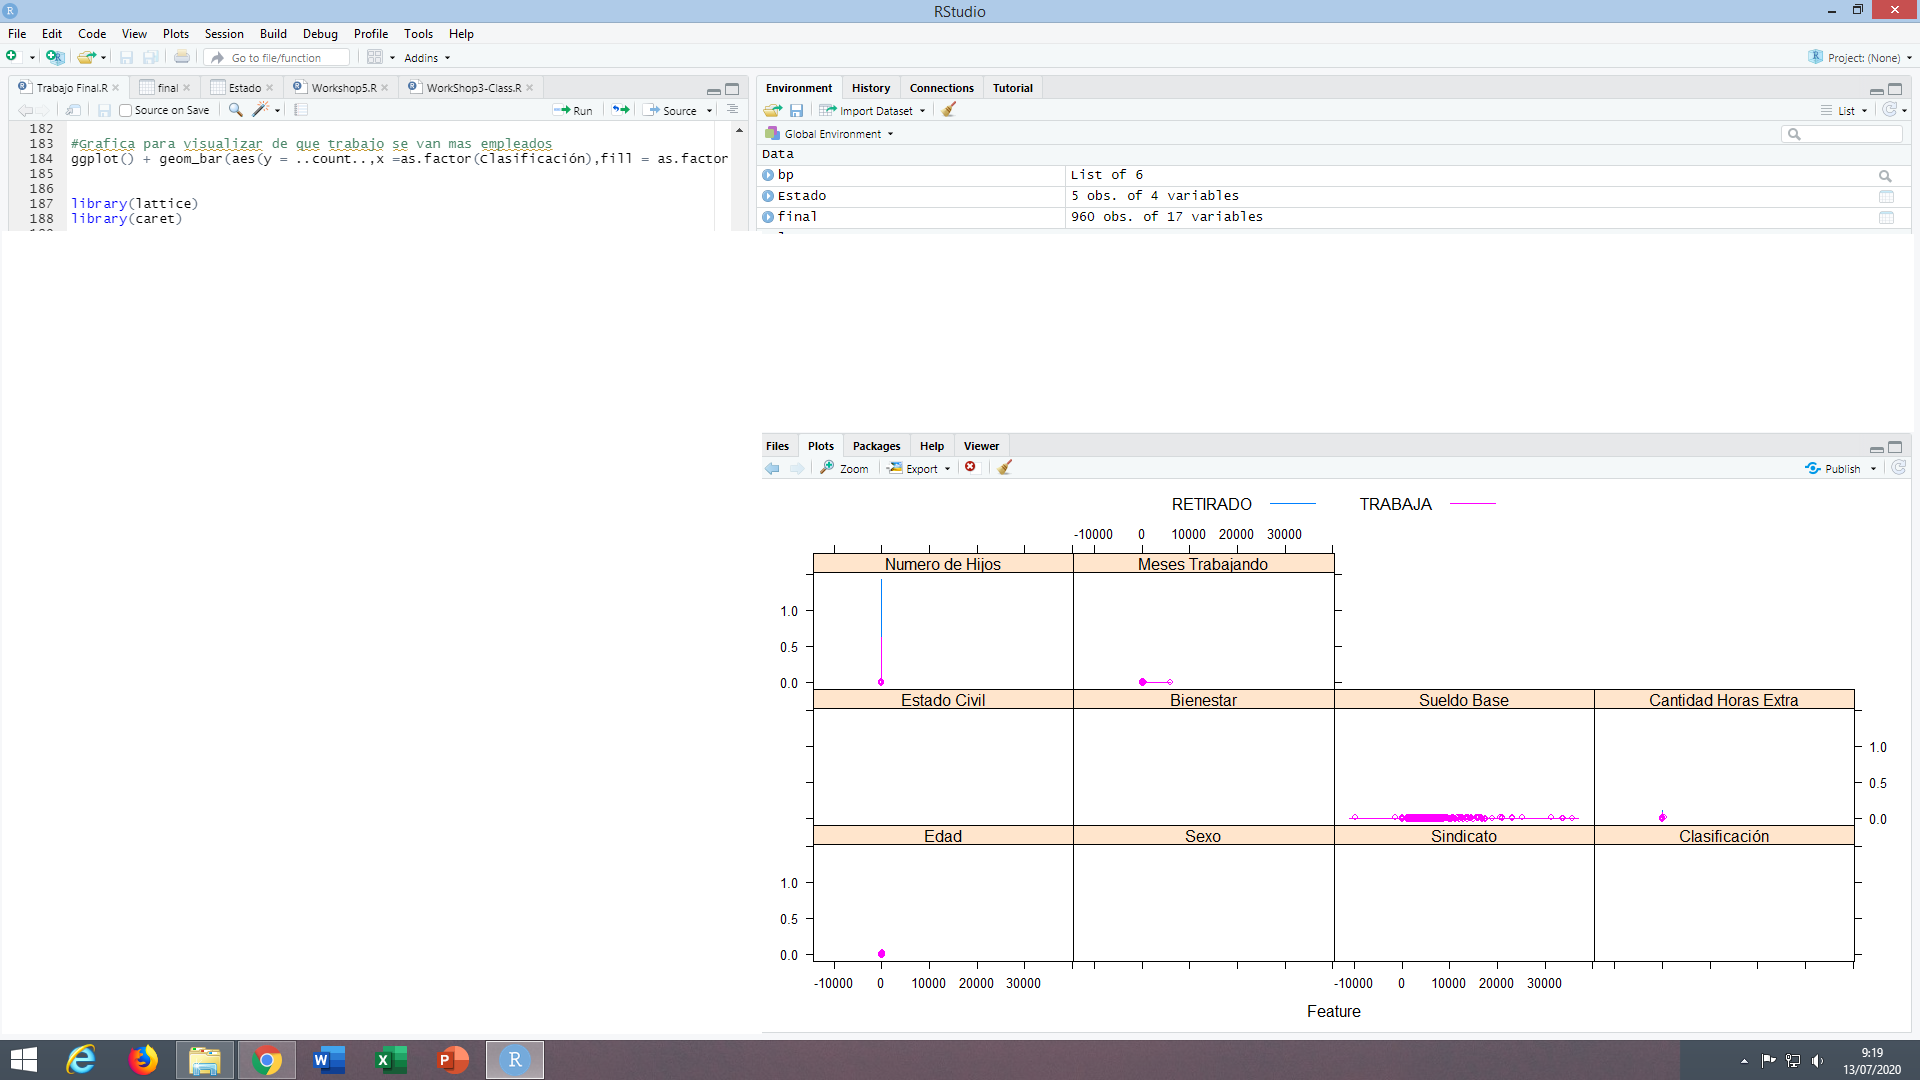
I tried changing the Label data type to factor and i reicive this plot:

and i have this Warning messages:
1: In (function (x, darg, groups = NULL, weights = NULL, subscripts = TRUE, :
NAs introducidos por coerción
2: In (function (x, darg, groups = NULL, weights = NULL, subscripts = TRUE, :
NAs introducidos por coerción
3: In (function (x, darg, groups = NULL, weights = NULL, subscripts = TRUE, :
NAs introducidos por coerción
4: In (function (x, darg, groups = NULL, weights = NULL, subscripts = TRUE, :
NAs introducidos por coerción
5: In (function (x, darg, groups = NULL, weights = NULL, subscripts = TRUE, :
NAs introducidos por coerción
6: In panel.superpose(x, darg = darg, plot.points = plot.points, ref = FALSE, :
NAs introducidos por coerción
7: In panel.superpose(x, darg = darg, plot.points = plot.points, ref = FALSE, :
NAs introducidos por coerción
8: In panel.superpose(x, darg = darg, plot.points = plot.points, ref = FALSE, :
NAs introducidos por coerción
9: In panel.superpose(x, darg = darg, plot.points = plot.points, ref = FALSE, :
NAs introducidos por coerción
10: In panel.superpose(x, darg = darg, plot.points = plot.points, ref = FALSE, :
NAs introducidos por coerción

So i apply this code for ommite NA :
final<-na.omit(final)
And again the plot gives me as a result : NULL

how many observations are left after you take out the Na's ?
does the y variable contain examples of both classes ?

1 Like

I thought the result will be somethig like this :

The data base contain 1000 data, after i taked out the Na's , 960 data are left

And yes, the Label variable (y) contains the examples look, this is the database

maybe we should recheck your entire script.
I'm wondering if your work omitting the NA's undid the work to have factors rather than chars (i.e. it was working to ... can you go back to it when it was working)

1 Like

Ok, i did it with the original data type in Label (chr), apllied the plot and gave meas a result NULL . Then i changed the Label data type to (factor), applied str function and is still with factor,i omite the NA, later i play the plot and give as a result the weird plot with 10 results, and the message about Warning with NA

str(final) from your image shows no factors though....

1 Like

Yes, im sorry that was the original.
The second one keeps it after i omited the Na's

if you want, i can send you the database, but it is in spanish

maybe you could dput your final dataframe here, or on github if its too big.
I can't reproduce your issue, even setting some values to be NA doesnt give me coercion messages, so not sure what is causing it.
maybe take out non numeric variables from your x object, I would guess it has something to do with that.

library(caret)
d<- iris
#add some NA's 
d[1,3] <- NA
d[2,5] <- NA
d[4,4] <- NA
featurePlot(x=d[,1:4],y=d$Species,plot ="density",auto.key = list(columns = 2))
# didnt give me any warnings though
d2 <- na.omit(d)
nrow(d)
nrow(d2)
featurePlot(x=d2[,1:4],y=d2$Species,plot ="density",auto.key = list(columns = 2))
#plots fine
1 Like

I DID IT, it was a problem with my x object, so when i had x=final[,3:12] this give me as a result all the columms betwen and not only the two i want. Soo i change the range of 3:12 to 3,12 and i have what i expected. lol
nirgrahamuk Thank you very very much, without your help i can't figure out.
Thank's mate

1 Like

This topic was automatically closed 7 days after the last reply. New replies are no longer allowed.