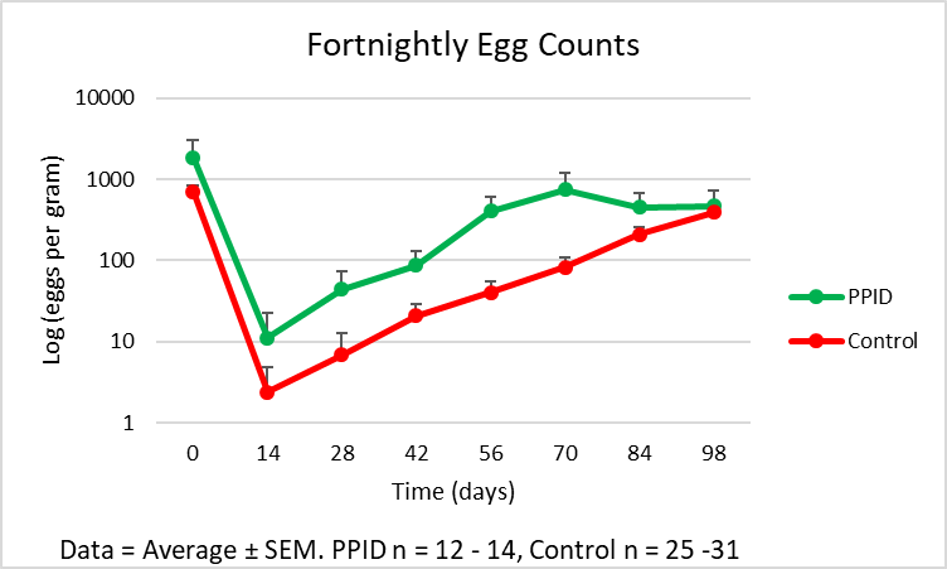
Hi, I’m new to R, finding the whole language very challenging, and struggling to get error bars on a line graph. I would like to make a graph in r like the one below that I did in excel.
I have loaded ggplot2, dplyr, tidyr and Hmisc".
My data looks like this
str(nb1498)
'data.frame': 45 obs. of 32 variables:
BiStatus : int 1 1 1 1 1 1 1 1 1 1 ... Horse : Factor w/ 45 levels "Amber","Anzac**",..: 41 21 35 27 4 42 11 26 18 30 ...
Age : int 19 34 20 14 20 10 39 34 30 26 ... ACTH : num 670 162 101 245 492 ...
Status : Factor w/ 2 levels "Control","PPID": 2 2 2 2 2 2 2 2 2 2 ... TotalFEC14.98 : num 38 18 28 12 33 27 10 11 20 29 ...
PTotalFEC14.99 : Factor w/ 14 levels "","201","2171",..: 14 5 9 4 13 8 2 3 6 10 ... CTotalFEC14.100 : Factor w/ 27 levels "","0","1","1013",..: 1 1 1 1 1 1 1 1 1 1 ...
TotalFEC : num 36 19 29 13 34 28 11 12 21 30 ... Day0 : int 79 15796 41 1202 1695 0 0 652 2925 915 ...
Day14 : int 0 0 0 0 156 0 0 0 0 0 ... Day28 : int 0 0 0 0 333 0 0 42 0 244 ...
Day42 : int 0 280 0 0 248 0 0 39 40 566 ... Day56 : int 0 2717 0 370 845 0 0 100 79 1143 ...
Day70 : int 0 5819 0 96 694 0 0 384 165 1292 ... Day84 : int 0 2172 0 290 85 0 201 405 157 288 ...
Day98 : int NA 3023 0 324 1777 40 0 549 160 207 ... Hypertrichosis : int 1 1 1 1 1 1 1 1 1 0 ...
Hyperhidrosis : int 1 0 1 0 0 0 0 1 0 0 ... Laminitis.hx : int 1 1 1 1 1 1 0 1 1 1 ...
Rings : int 1 1 1 0 1 1 0 0 0 1 ... Whitleline : int 0 0 0 1 0 0 0 0 0 0 ...
FatDeposits : int 1 1 0 1 0 0 0 0 0 0 ... MuscleLoss : int 1 1 1 0 0 0 1 0 0 0 ...
BCS : num 7 6 6 7 6 6 8 8 7 8 ... Stocking.rate : Factor w/ 13 levels "","1-Jan","1/.5",..: 13 8 5 12 2 11 4 4 11 4 ...
Neutrophil : num 0.69 0.76 0.26 0.33 NA NA NA NA NA NA ... Lymphocyte : num 0.18 0.2 0.66 0.57 NA NA NA NA NA NA ...
Monocyte : num 0.07 0.02 0.04 0.07 NA NA NA NA NA NA ... Eosinophil : num 0.06 0.01 0.04 0.03 NA NA NA NA NA NA ...
BandNeutrophil : num 0.48 0.08 0.05 0.04 NA NA NA NA NA NA ... Mature.Neutrophils: num 0.2 0.68 0.21 0.29 NA NA NA NA NA NA ...
But I stacked it do be this for making the graph
head(Stack_nb1498)
Status FEC Day
1 PPID 0 Day14
2 PPID 0 Day14
3 PPID 0 Day14
4 PPID 0 Day14
5 PPID 156 Day14
6 PPID 0 Day14
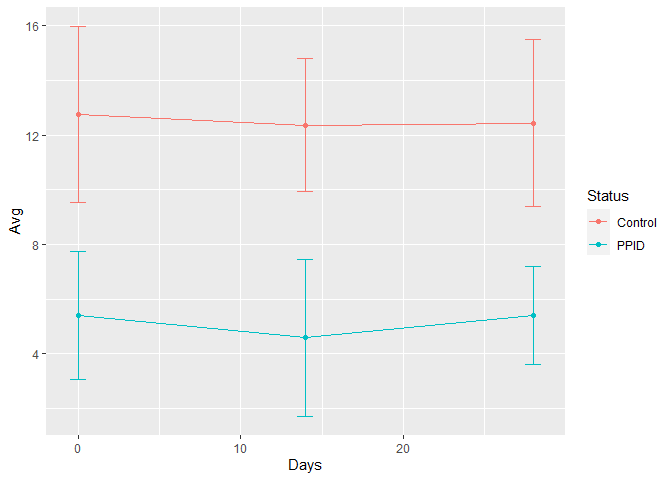
This is my attempt (that somewhat works) so far…. Any help would be great!
#Make a blank graph to add things to
FECDayline <- ggplot(Stack_nb1498, aes(Day, FEC), na.rm=TRUE)
FECDayline
#stat summary to calculate the means and plot them as points
FECDayLinePoint <- FECDayline + stat_summary(fun = mean,
geom = "point")
FECDayLinePoint
#Now add the line (need aes(group = 1) to make the line and tell it there's only one line
FECDayLinePoint2 <- FECDayLinePoint + stat_summary(fun = mean,
geom = "line",
aes(group=1))
FECDayLinePoint2
#Trying to get both PPID and Control plotted
#It really likes to have stat_summary again. Can't just use the name + ...
FECDayLinePoint3 <- FECDayLinePoint + stat_summary(fun = mean,
geom = "line",
aes(group=Status),
col ="Red", linetype = "dashed")
FECDayLinePoint3
#Add error bars using normal distribution rather than the bootstrap distribution
FECDayLinePoint4 <- FECDayLinePoint3 + stat_summary(fun.data = mean_cl_normal(Day, FEC),
geom_errorbar(aes(ymin=FEC-sd, ymax=FEC+sd)))
FECDayLinePoint4