I think I have calculated the straight line of a geom_smooth line in a generated figure but would like to make it tidier. See example below:
Example data called data2:
Well_numbers Sample Dilution mIU.mL Type
1	Dilution 1:200	0.005	1.4450	Control
2	Dilution 1:200	0.005	1.2905	Control
3	Dilution 1:200	0.005	1.4425	Control
4	Dilution 1:500	0.002	1.1065	Control
5	Dilution 1:500	0.002	0.9475	Control
6	Dilution 1:500	0.002	0.9955	Control
library(ggplot2)
library(Hmisc)
lm_eqn = function(data2){
    m = lm(mIU.mL ~ log10(Dilution), data2);
    eq <- substitute(italic(y) == a + b %.% italic(x)*","~~italic(r)^2~"="~r2,
         list(a = format(coef(m)[1], digits = 4),
              b = format(coef(m)[2], digits = 4),
             r2 = format(summary(m)$r.squared, digits = 3)))
    as.character(as.expression(eq));
}
ggplot(data2, aes(log10(Dilution), mIU.mL)) +
  stat_summary(fun.y = mean, geom = "point") +
  labs(title = "My Informative Title", x = "X axis label", y = "Y axis label") +
  geom_smooth(method = "lm", se = TRUE, colour = 'green')+theme_light() + geom_text(x = -3, y = 1.2,label = lm_eqn(data2), parse = TRUE)
My output is:
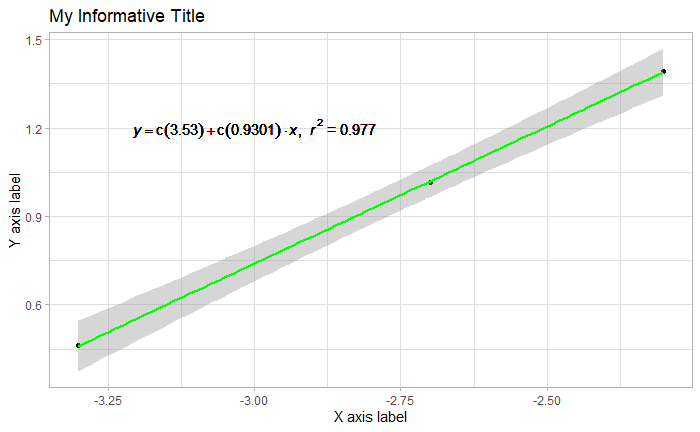
The equation of the line is y = c(3.53) + c(0.9301)x
I believe this is the same as y = 0.9301x + 3.53 (or y = 3.53 + 0.9301x). This makes sense when inputting the known data.
If this is true does anyone know how I remove the c values from the equation in the graph above? Or another way to calculate the equation of the straight line generated in the graph?
Thanks in advance.