I'm having problems controlling the aspect ratio of ui.card elements in Shiny Express. The cards are intended to contain data generated by matplotlib and I'd like to enforce a square shape.
Example code to demonstrate:
from shiny.express import render, ui
import matplotlib.pyplot as plt

def donutchart(sizes):
    # Ensure plot is square
    fig, ax = plt.subplots(figsize=(1,1))

    # Color whole plot canvas to see "true" size vs e.g. white background
    fig.patch.set_facecolor('xkcd:mint green')

    props = { 'width': 0.5, 'linewidth': 1, 'edgecolor': 'white' }
    ax.pie(sizes, wedgeprops=props)

    # Print size of plot in pixels, to check the results are square
    print( fig.get_size_inches() * fig.dpi )

with ui.layout_column_wrap(fill=False):
    # This use of 'style' to set the aspect ratio does not work.
    with ui.card( style='aspect-ratio: 1/1' ):
        @render.plot
        def plot1():
            donutchart( [1,1,1,1] )

    with ui.card():
        @render.plot
        def plot2():
            donutchart( [1,2,3,4] )

    with ui.card():
        @render.plot
        def plot3():
            donutchart( [1,2,4,8] )
As you can see, the example code just sets up three ui.card items inside a ui.layout_column_wrap element. The matplotlib code generate a plots and prints out the size of the figure (in pixels) to check the specific dimensions of the matplotlib output to make sure they don't force some sort of vertical resize of the ui.card elements.
Example console output:
$ shiny run tmp.py
INFO:     Started server process [24523]
INFO:     Waiting for application startup.
INFO:     Application startup complete.
INFO:     Uvicorn running on http://127.0.0.1:8000 (Press CTRL+C to quit)
INFO:     127.0.0.1:59032 - "GET / HTTP/1.1" 200 OK
INFO:     ('127.0.0.1', 59034) - "WebSocket /websocket/" [accepted]
INFO:     connection open
[200. 200.]
[200. 200.]
[200. 200.]
... so we can see that matplotlib is indeed respecting the square size when generating the figures (they are all 200x200 pixels).
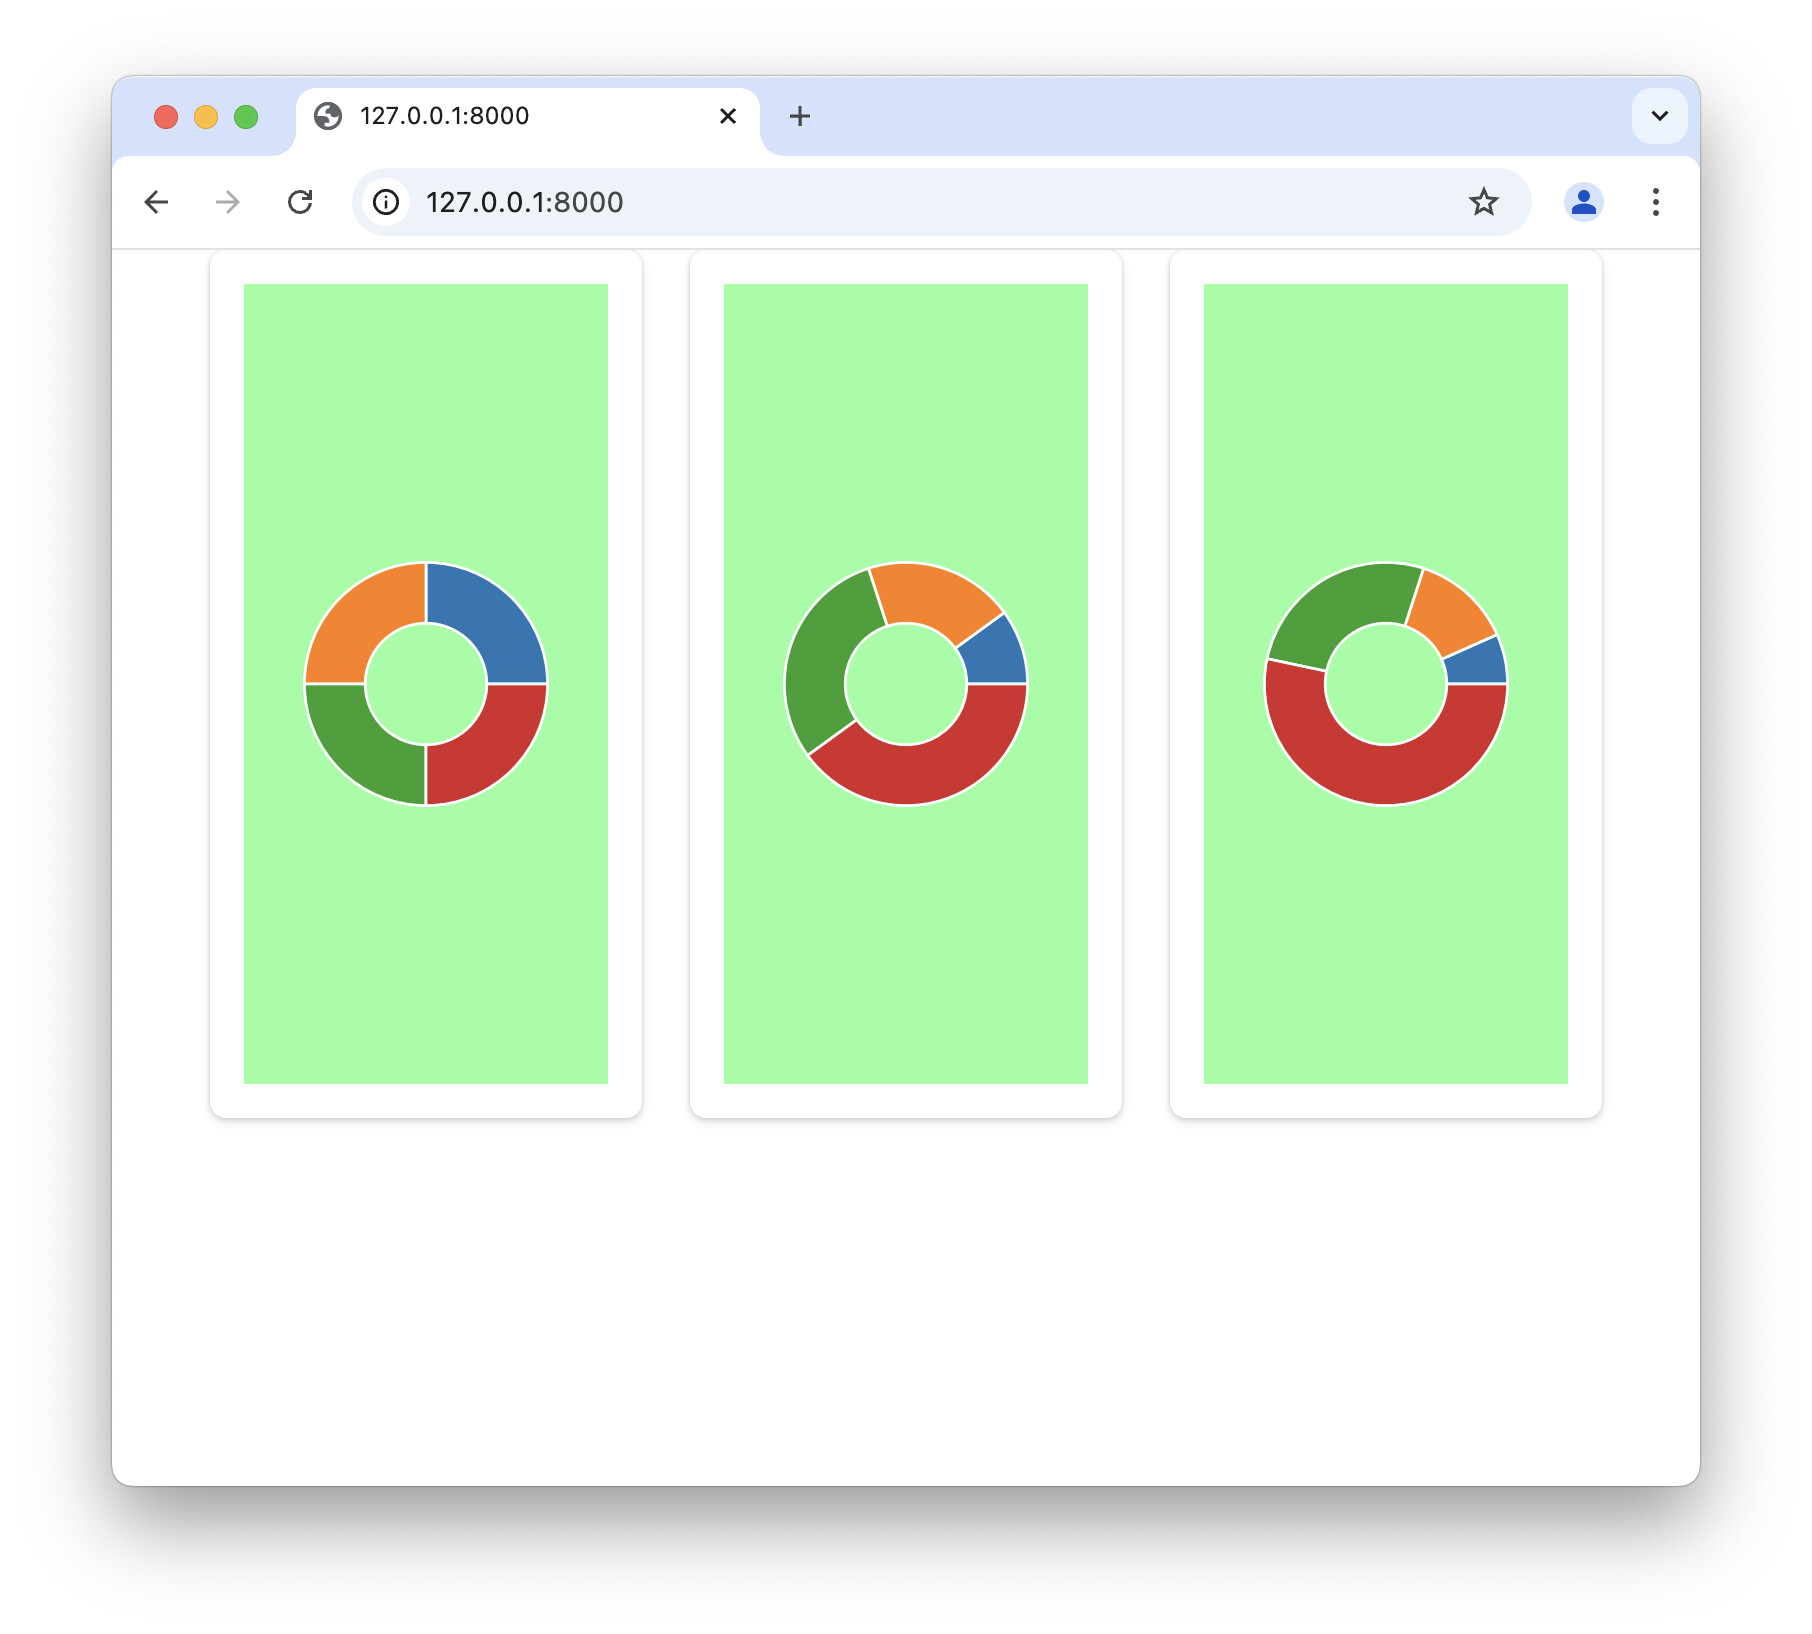
However, resizing the browser window clearly shows that the aspect ratio set in the first ui.card is not respected (style='aspect-ratio: 1/1'). Furthermore, the green background of the matplotlib output plots fill the whole card - which they shouldn't, as the canvas of each plot is square (as shown in the console output - always 200x200 pixels).
Here is an example screenshot. I'd like to add more, but as a new user I can apparently only attach one.
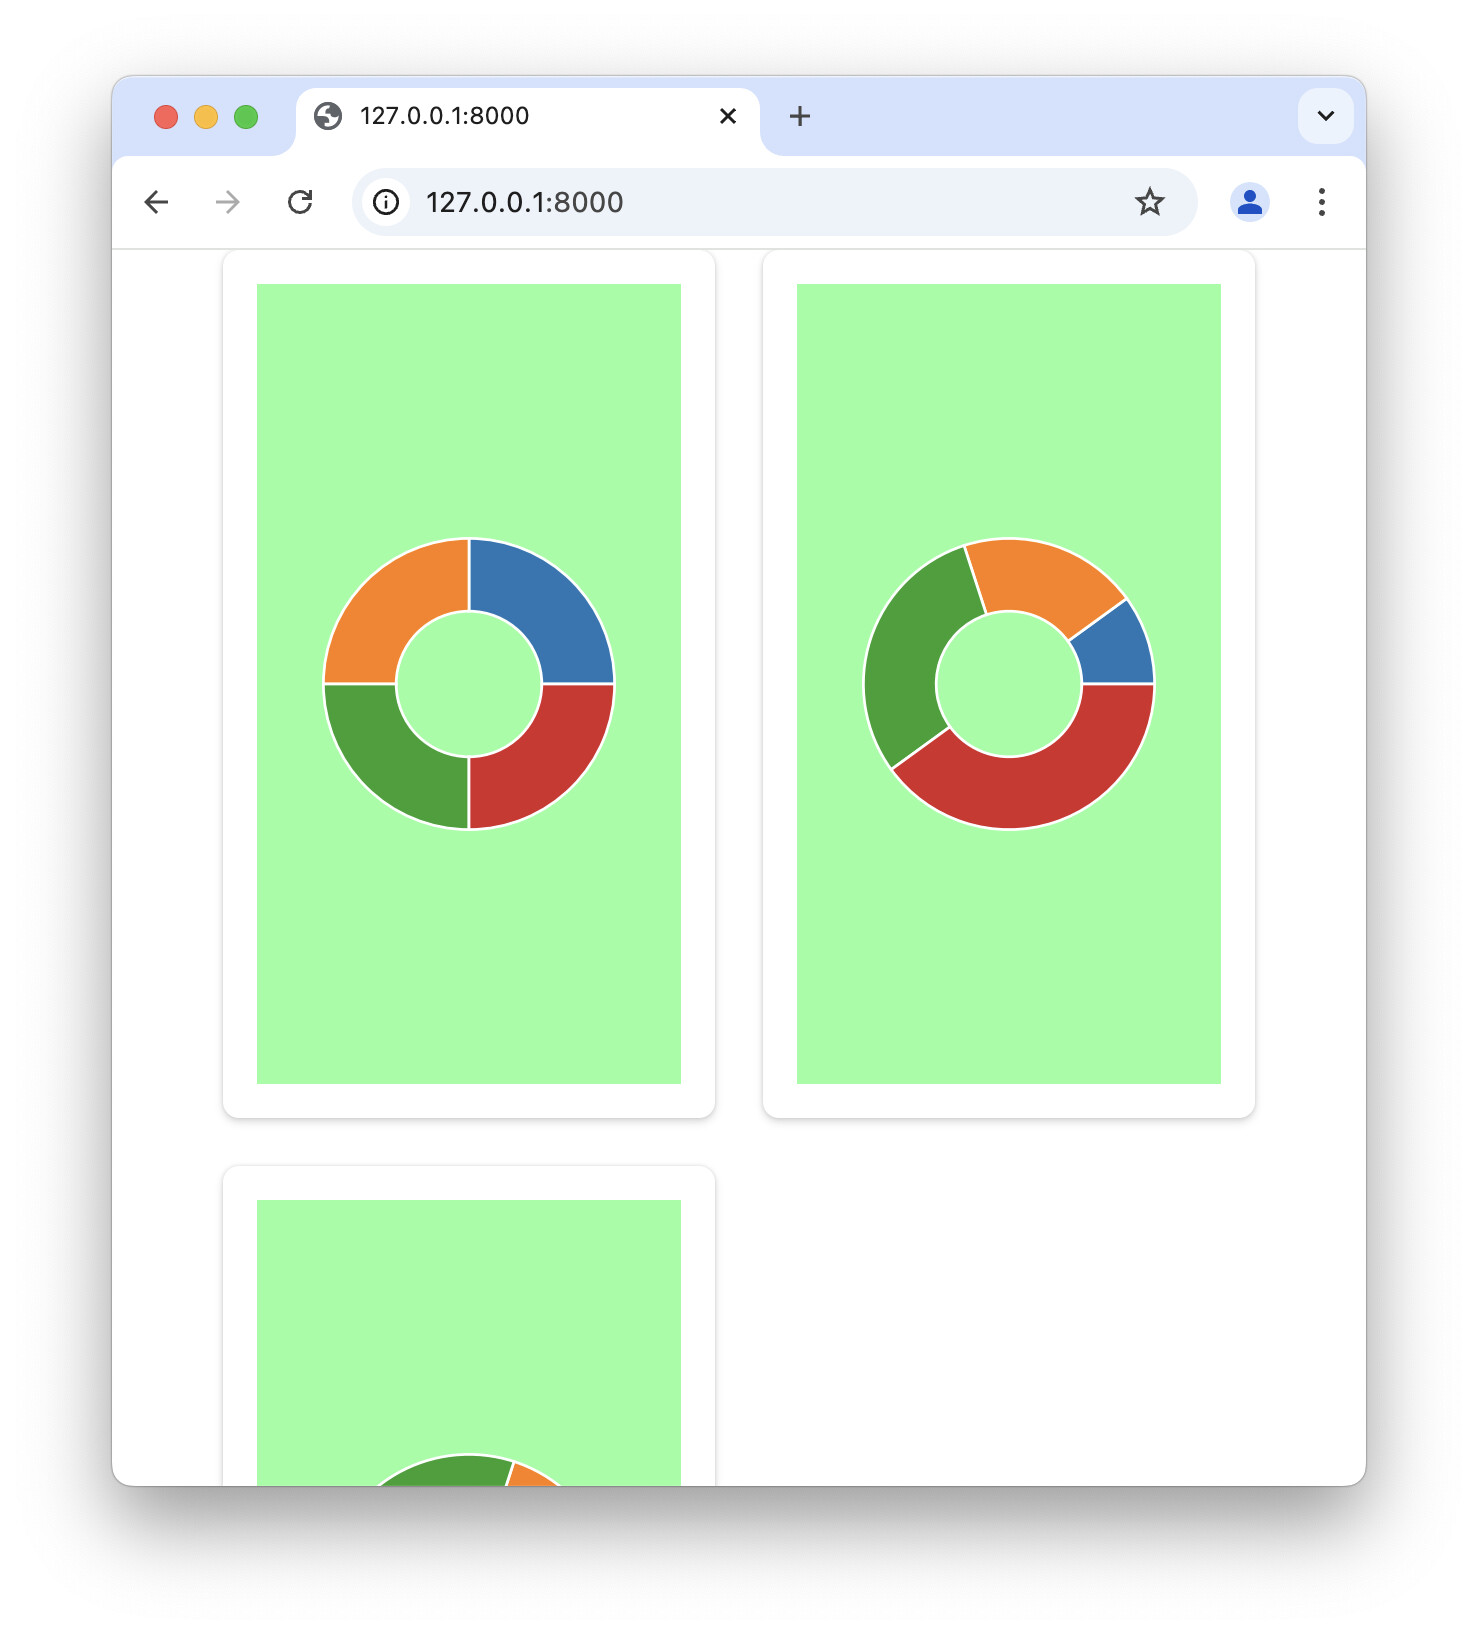
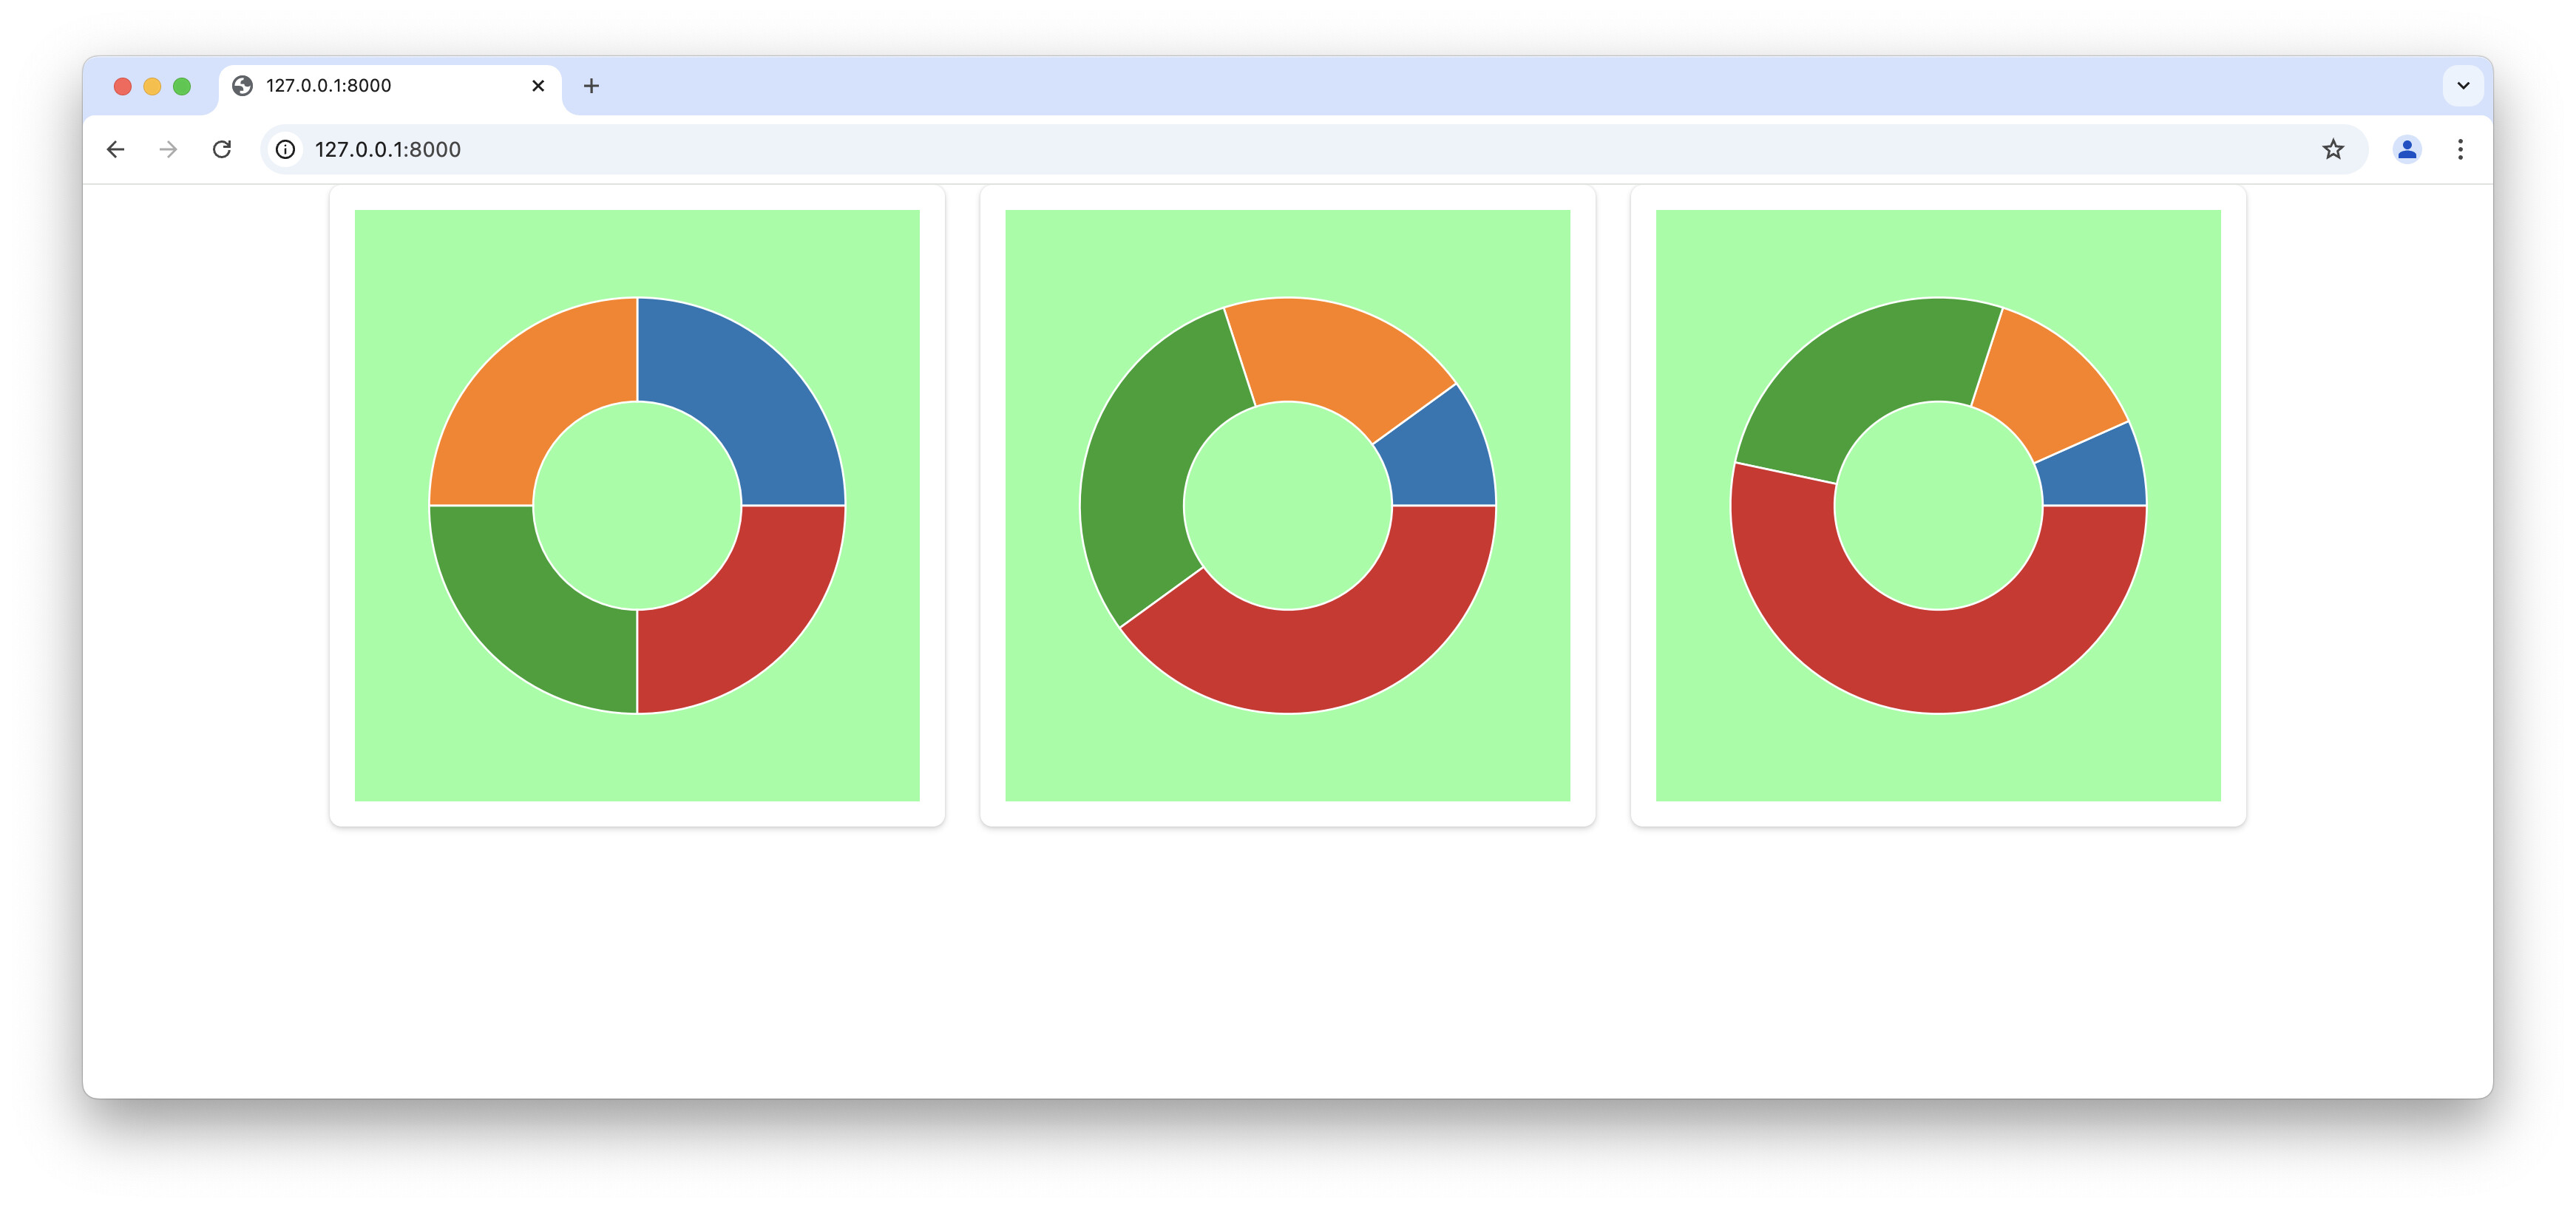
The ui.card elements remain in the same non-square proportions as I resize the browser horizontally so all three cards are shown on the same line. The ui.card elements only become square after I resize the browser window on the x-axis beyond what the responsive flow seems to be able to entirely fill horizontally.
How can I enforce that the ui.card elements be square?