I created a logistic regression and one fo the explanatory variables is age in a continuous format. I wonder if I could examine the effect of this variable along the range 18 - 90. I would like to know whether there is any 'jump'. Do you have any advice?
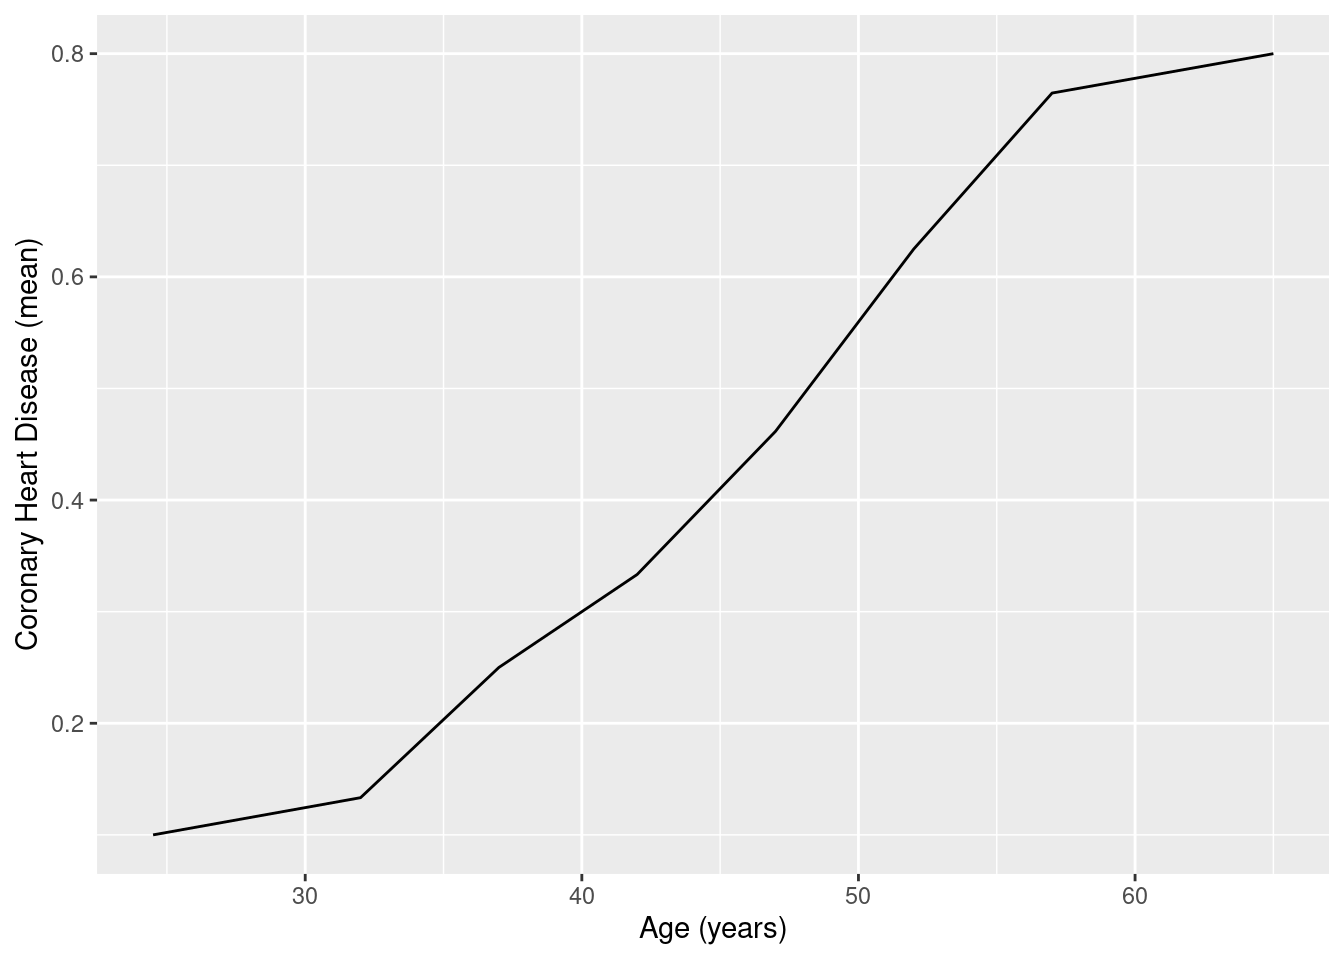
See my post using the CHD dataset, which contains the binary outcome of coronary heart disease detected against age cohort, using the continuous variable age binned into age groups.
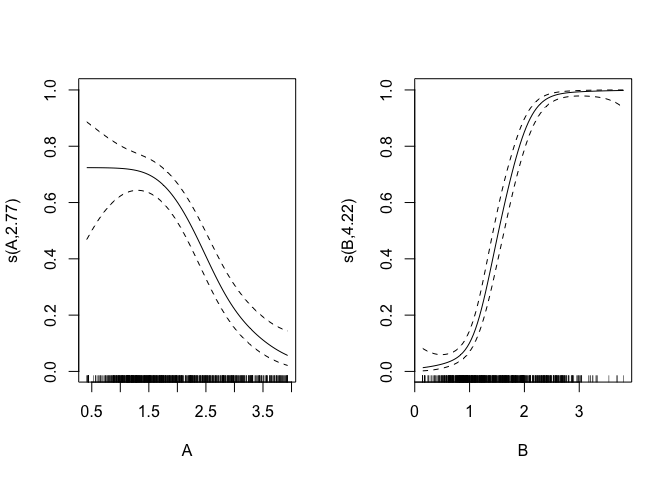
I suggest using a generalized additive model to plot the smooths for the predictor (similar to geom_smooth()). For example:
library(modeldata)
library(mgcv)
#> Loading required package: nlme
#> This is mgcv 1.8-33. For overview type 'help("mgcv-package")'.

data("two_class_dat")

mod <- gam(Class ~ s(A) + s(B), data = two_class_dat, family = binomial)

# The `trans` argument puts them back on the probability scale

plot(mod, trans = function(x) binomial()$linkinv(x), pages = 1)