The QCC graph is always with no color.
How can I define some colors of the bars in the graph? I can't find the syntax documentation.
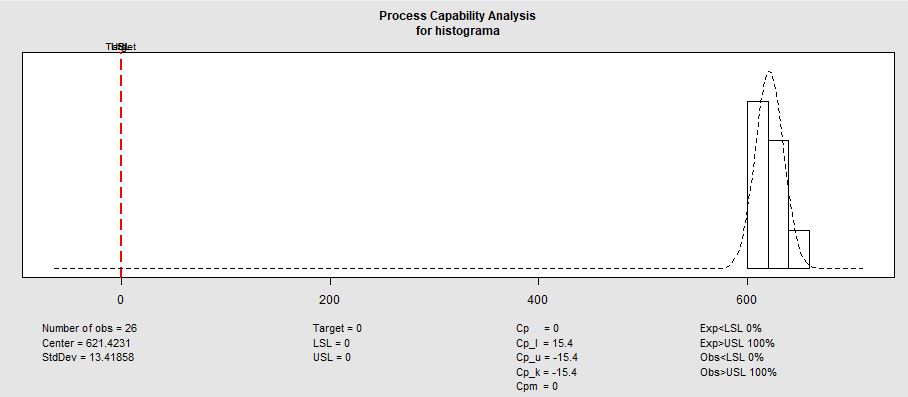
 #Campo gerar histograma
  output$histograma <-renderPlot({
    a = qcc(histograma, type="xbar", plot = TRUE)
    process.capability(object = a, spec.limits = c(input$lininf,input$linsup))
  })

  #Grafico de Normalidade
  output$normalidade <-renderPlot({
    ss.study.ca(normalidade, LSL = input$lininf, USL = input$linsup, Target = ((input$lininf+input$linsup)/2),alpha = 0.05, f.main = "Teste de Normalidade")

  })